Moving Averages Form A Triangle in EUR/GBP
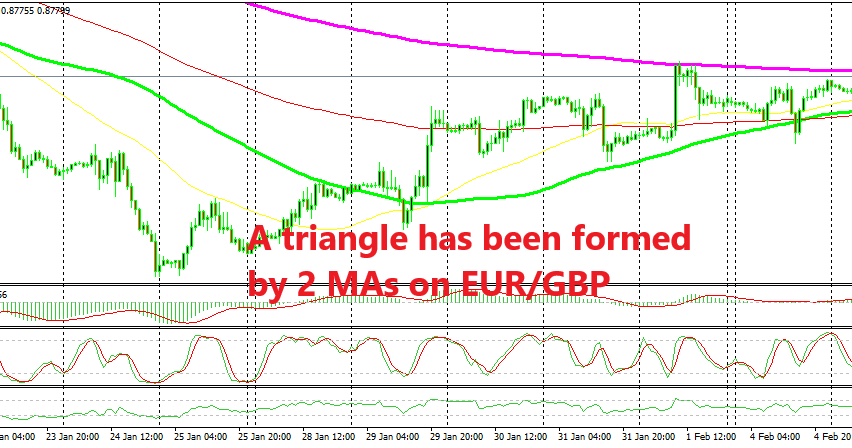
EUR/GBP has formed a triangle on the H1 chart,but the top of the triangle seems to be in danger now

EUR/GBP has been on a bearish trend during most of January. But it started to climb higher in the last week of the previous month and it turned bullish eventually as the Brexit process got more complicated than it already was. Odds of Brexit being postponed have increased despite Theresa May’s comments that the end of March will be the exit date. That will push the uncertainty further down the road for another year or so and that has left business on a crossroad.
As a result, the GBP has turned bearish in the last two weeks, which means that EUR/GBP has turned bullish. This pair pushed above the 50 SMA (yellow) on Monday last week and on the next day it pushed above the 100 SMA (green) as well.
The 100 SMA then turned into support for EUR/GBP and it has been pushing this pair higher for about a week, turning into the bottom line on a triangle which has formed between this moving average and the 200 SMA (purple) at the top. The 200 SMA has provided resistance during this time, acting as the top line of the triangle.
We can call it a wedge as well since the triangle hasn’t closed yet, meaning that the 2 moving averages haven’t touched yet. During the Asian session this pair moved lower to the 100 SMA, but that moving average provided support once again and the disappointing services report from the UK sent this pair higher again to the top of the triangle/wedge.
Now, the top of the range seems in danger. If it gets broken to the upside, then the 200 SMA will likely turn into support, so it will be a good place to look for longs on EUR/GBP.
- Check out our free forex signals
- Follow the top economic events on FX Leaders economic calendar
- Trade better, discover more Forex Trading Strategies
- Open a FREE Trading Account


