The 50 SMA Comes Back to Life in S&P – Break or Retrace?
The 50 SMA was broken support for S&P on the weekly chart, but it is back into spotlight now.
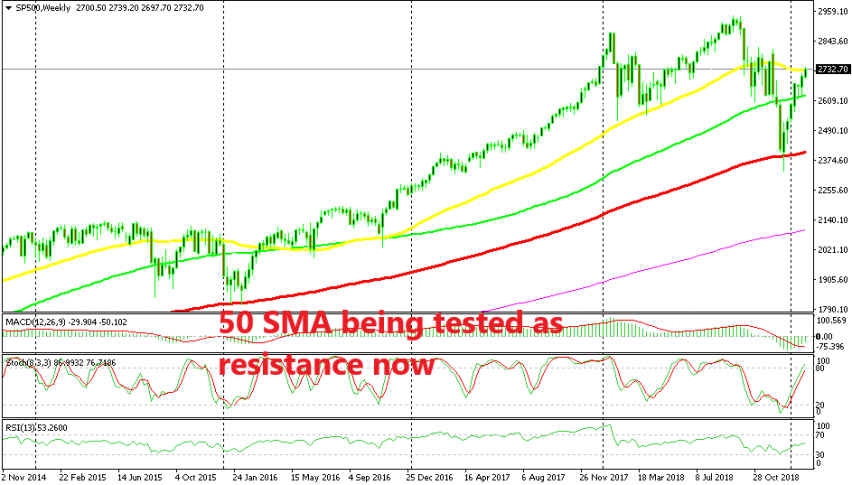
S&P has been on an uptrend for years but it made a bearish reversal in October last year with all other stock market indices as the sentiment turned negative. During the uptrend, the S&P has leaned on the 50 SMA(yellow) which has provided solid support apart from one time early in 2016 when the 100 SMA (red) took its place and reversed the decline.
The 50 SMA continued to provide support until late last year when a weakening world economy, trade war and Brexit turned risk assets upside down. The 50 SMA was broken once again in October and then it turned into resistance.
The decline resumed in December after bouncing between the 50 SMA and the 100 SMA (green) on the weekly chart. The 100 SMA got broken that month but the 100 smooth MA (red) held its ground once again and the reverse began.
The S&P pushed above the 100 simple MA in January but it now faces the 50 SMA again. The price is right at this moving average at the moment. There could be a break to the upside, but we could also see another bounce between this moving average and the 100 simple MA.
If the 50 SMA gets broken, then it will turn into support and it will be a good place to buy. If we see it act as resistance, then the 100 simple MA might be a good place to buy on a retrace lower.
- Check out our free forex signals
- Follow the top economic events on FX Leaders economic calendar
- Trade better, discover more Forex Trading Strategies
- Open a FREE Trading Account
- Read our latest reviews on: Avatrade, Exness, HFM and XM
Related Articles


Sidebar rates
Related Posts
