Buying the Pullback in USD/JPY
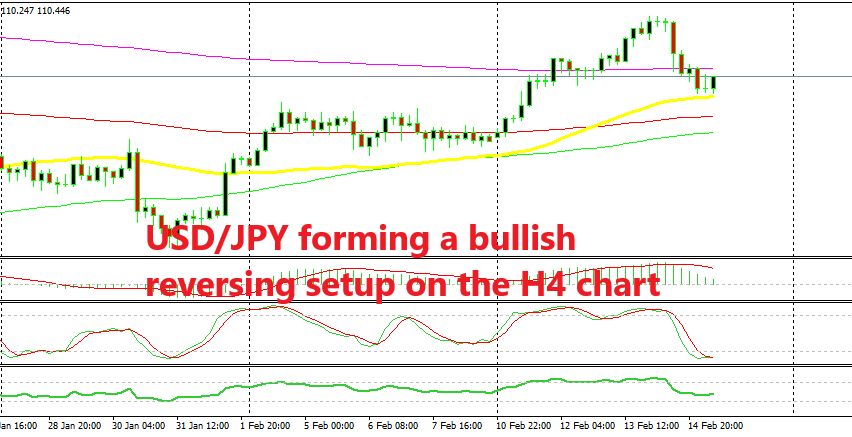
USD/JPY has pulled back lower and it has become oversold on the H4 chart, which means that the retrace is complete now.

[[USD/JPY]] has been trading in an uptrend since the beginning of January after it crashed 5 cents lower. This pair has been recuperating pretty well since then, although I was in doubt whether this move of the last several weeks was a real shift in the trend or if it was just a decent retrace before the next bearish move lower.
But this week, USD/JPY made a clear break above the 100 level and it has remained above that major round level, which shows that the trend has reversed to bullish, since this pair is considered bullish above 110. So, from selling, we have shifted our trading plan to buying now.
We waited for a retrace lower which came yesterday pulled back nearly 100 pips lower. This morning, I saw that this pair had become oversold on the H4 chart as the stochastic indicator shows, so the retrace seemed complete. The 40 SMA (yellow) which has acted as support and resistance before is also providing support. On top of that, the previous H4 candlestick formed a doji which is a bullish reversing signal after the pullback, as you can see from the H4 chart above.

The 100 SMA is providing support on the H1 chart
If we switch to the H1 chart, we see that USD/JPY became oversold on this time-frame as well this morning. Besides that, this pair is finding support at the 100 SMA (red) on this chart, which should add some more strength to the support area around 110.20, which was the high last week.
So, we went long on USD/JPY based on these charts and now we see that the price is reversing higher. Time to be patient now on this trade.
- Check out our free forex signals
- Follow the top economic events on FX Leaders economic calendar
- Trade better, discover more Forex Trading Strategies
- Open a FREE Trading Account


