What a fantastic week for Bitcoin! Not only did Elon Musk call Bitcoin brilliant, but Bitcoin also rose by 15 percent and the total market capitalization surged by nearly 20 percent in the last seven days. While there was bullish news this week, the technical analysis gives hints that the cryptocurrencies’ market is currently at a very important key level.
BTC/USD DAILY CHART
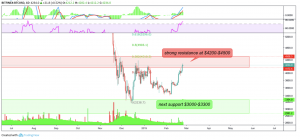
Bitcoin managed to climb all the way up to the very strong resistance between $4200-$4500. Interestingly enough, the 0.382 fib extension level is located exactly at the upper region of this very strong resistance. Thus, if Bitcoin fails to break the resistance, the rejection of the 0.382 fib level would act as confirmation of a continuation of the bear trend. As a consequence, Bitcoin would most likely find its next support around $3300. In addition, the RSI has reached overbought regions, which makes a short-term price correction more likely.
BTC/USD 4H CHART
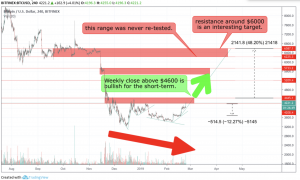
However, if Bitcoin manages to break the resistance with volume and close above $4600 in a weekly candle, we can assume further upward movement. While the steady decline of the volume is quite bearish, the fact that Bitcoin never re-tested the $6000 is indeed a very bullish argument. In fact, Bitcoin will find its next resistance between $5700-$6800 if it breaks the current resistance. This would result in a rise of nearly 50 percent.
ETH/USD DAILY CHART
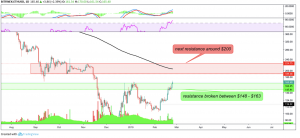
Ethereum actually broke the resistance between $148-$163 today. However, Ethereum needs a weekly close above that region to confirm that this resistance is bullishly broken. With the RSI reaching overbought regions, we could assume a short-term price correction, where the newly established support at around $150 could be our potential correction target. Having said that, the current outlook makes it highly likely that Ethereum is on its way to the next major resistance around $200. Interestingly enough, the 200-day-EMA acts as additional resistance at $200.
TOTAL MARKETCAP/CRYPTO DAILY CHART
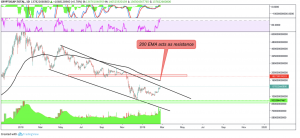
The total market capitalization is at an important key level. Currently sitting at $137b, it sits exactly at the channel resistance. If bullishly broken, the next resistance will be faced between $160b and $190b, where the 200-day-EMA acts as additional resistance.
In contrast to Bitcoin, the volume of the overall market cap of the cryptocurrencies market is increasing significantly. While the RSI indicates overbought regions, the increase in volume gives a bullish signal of a potential break of the channel resistance. If it faces rejection, the next support will be found around $93b.
Unfortunately, Cryptopia remains offline despite the green light from the Police.
However, very bullish news was brought by Germany, as the BaFin approved the first Security Token Offering (STO) in Germany.
In addition, the Spanish bank giant Banco Santander has signed a technology agreement with IBM. The deal, which is expected to cost $ 700 million, provides for the bank to use the technology company’s blockchain infrastructure.


