Gold Finding Support at the 50 SMA Again
Gold XAU
GOLD has been trading in a bullish trend since September last year. It had some difficulties breaking above the big level at $1,300 but it eventually broke that resistance level late in January and the bullish trend gained additional pace after that, pushing to $1,346 last week.
Although, the price formed an upside-down hammer on the daily chart last Wednesday if you want to check that time-frame. That’s a strong reversal signal and after that, Gold formed a big bearish candlestick the next day which confirms the bearish reversal. Gold lost around $26 in the second half of the week, wiping out the gains made in the first few days.
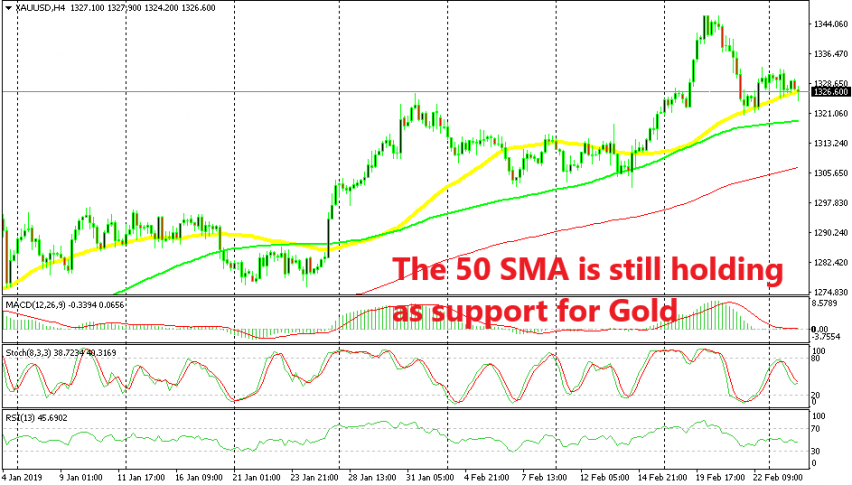
But, it found support at the 50 SMA (yellow) on the H4 time-frame as you can see from the chart above. It bounced off this moving average at the end of last week and it has been finding it pretty difficult to break below it. There have been piercings such as earlier this morning, but now breaks since the price has returned back up.
But, the sentiment has shifted somewhat this week as China and the US seem to be getting along fine on the negotiations. That has given risk assets a boost but it has hurt the safe haven assets such as Gold and the JPY. So, there’s a decent chance that Gold really turns bearish now. The signal of a bearish reversal would be the break of the 50 SMA. If this moving average is broken to the downside, then it would be a good place to sell on pullbacks.
- Check out our free forex signals
- Follow the top economic events on FX Leaders economic calendar
- Trade better, discover more Forex Trading Strategies
- Open a FREE Trading Account