From Resistance Into Support for Bitcoin
Bitcoin has made a move lower today but it is facing an indicator which used to provide resistance earlier.
February turned out to be a good month for cryptocurrencies as BITCOIN climbed from $3,300 to $4,000. But the climb ended right at that resistance level as I pointed out in another fore update early this morning. Bitcoin turned bearish last week and it has been quite bearish today as well, bit I missed something important on the previous Bitcoin update.
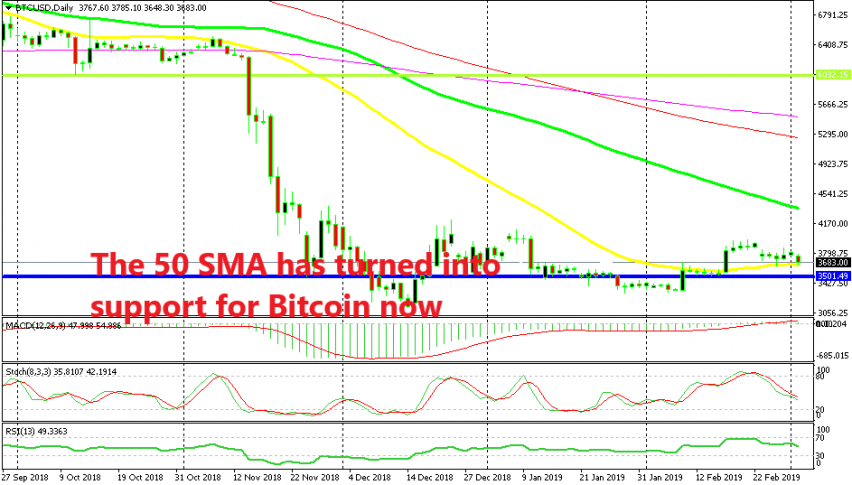
Bitcoin has lost more than $100 today as the sellers continue to push lower, but it has reached an important indicator on the daily chart. This indicator is the 50 SMA (yellow) which has provided resistance to Bitcoin many times before when cryptos were on their way to crash lower.
You can see from the chart above that this moving average topped the price in October, in November and again in the first half of last month when the reversal began. Now, Bitcoin is trying this moving average from the top side and it is showing some resilience which tells us that it might actually turn into support.
After all, that’s what these indicators do, they provide resistance for some time, then they turn into support and vice-versa. The sellers tried to break the 50 SMA last Thursday during a quick spike lower, but the price reversed quickly higher. This is the second test, so let’s hope that the 50 SMA finally breaks this time since we are already short on this altcoin since early February.
- Check out our free forex signals
- Follow the top economic events on FX Leaders economic calendar
- Trade better, discover more Forex Trading Strategies
- Open a FREE Trading Account
- Read our latest reviews on: Avatrade, Exness, HFM and XM
Related Articles


Sidebar rates
Related Posts
