We had a forex signal in AUD/USD yesterday which we opened the day before as this pair was retracing higher. In fact, I opened that signal a bit prematurely since the price hadn’t reached the 50 SMA on Wednesday, but the Australian GDP for Q4 of 2018 came much lower in the Asian session that day which turned this pair even more bearish.
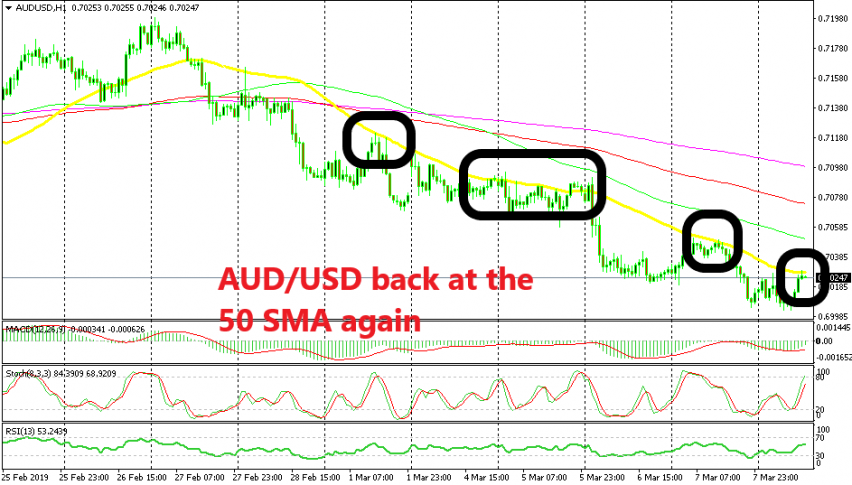
The retrace continued higher and yesterday the price met the 50 SMA (yellow), as you can see from the H1 chart above. This moving average has been support before and it turned into resistance once the trend shifted. It has killed all pullbacks higher during this week, which makes it the perfect resistance indicator.
So, the chart setup right now looks like another failure in the making for buyers. The trend is still quite bearish, the stochastic indicator has become overbought, which means the retrace is complete and the previous candlestick has closed as an upside-down pin which is a reversing signal. For this reason, I decided to take this opportunity and go short on this pair again. Now waiting for the reversal to begin.


