EUR/USD Bouncing Between Long-Term Fibo Levels


[[EUR/USD]] made a big bullish move yesterday after the FED turned dovish unexpectedly and surged nearly 100 pips higher in less than an hour. The buyers had been banging heads against the 100 SMA (green) on the daily chart all week, unable to break above it, but the FED gave them one more reason to push higher and the 100 SMA was finally broken.
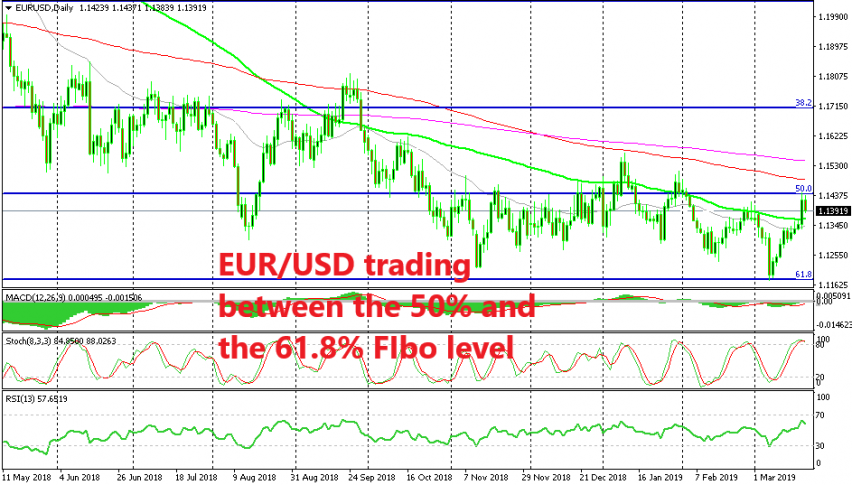
But, the surge stopped right at a major Fibonacci level. This is the 50% level of the big uptrend that we saw in 2017. We drew the low at 1.0330 from back in January 2018 and the top at 1.2550s from early last year. EUR/USD broke below the Fibo levels last year as the trend reversed to bearish.
But the decline stopped right at the 61.8% Fibo level earlier this month as you can see from the daily chart above. Then, the buyers became active down there even though the European Central Bank turned dovish. They reversed the price and pushed higher to the 50% Fibo level yesterday where the climb stopped.
So, this pair seems to be trading between these two levels now which look like good places to go long and short from. I don’t think this pair will go anywhere anytime soon, despite the divergence in the US and the Eurozone economies. Therefore, we will try to sell close to the 50% Fibo level and buy at the 61.8% level.