Global Economic Slowdown Weighs on Crude Oil – Technical Outlook
Crude oil has been a couple of weeks, crude oil is maintaining a big trading range of $60.45 - 58. The market is a bit confused between...
•
Last updated: Tuesday, March 26, 2019
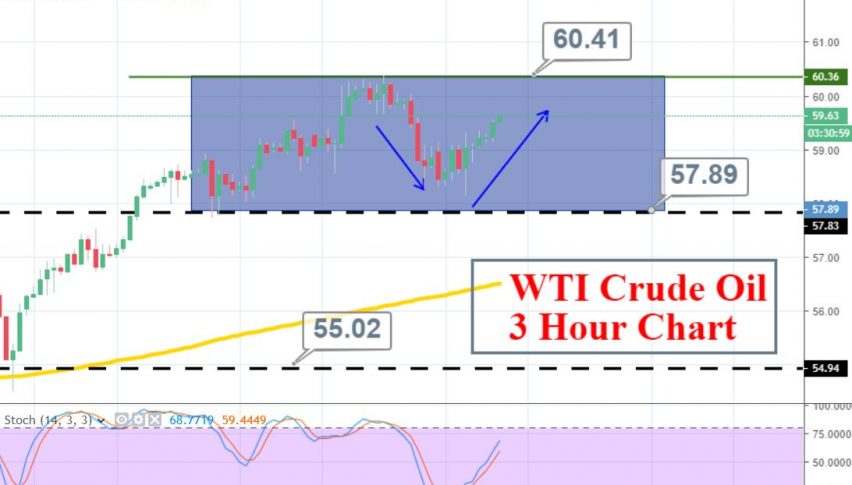
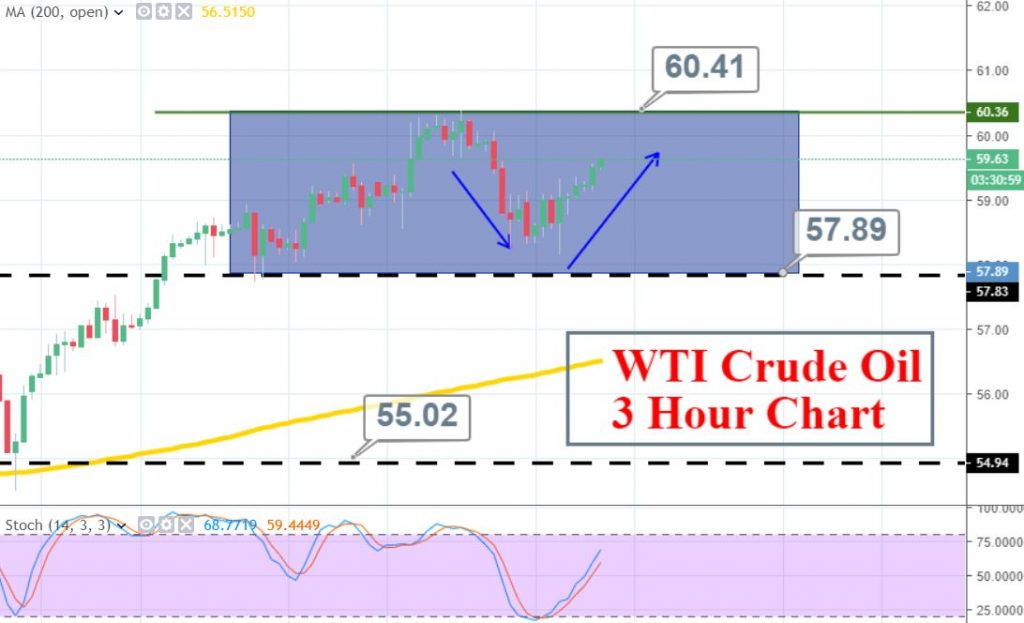
In the past couple of weeks, crude oil has been maintaining a big trading range of $60.45-58. The market is a bit confused whether to sell it over global economic slowdown sentiment or buy it on the prospect of tighter US crude supply.
The recent jump in crude oil prices has been triggered by the dovish Federal Reserve, and weak factory data from the United States, Europe and Asia. For now, there’s no solid reason to predict a clear trend via fundamental analysis, but the technical indicators can help us here.
WTI Crude Oil – Technical Analysis
- On the 4-hour chart, crude oil is facing stiff resistance at $60.40 along with support around $58. The lack of volatility and trading volume are keeping it floating in this range from March 15.
- The 200 periods moving average is far away from the current market price, confirming a bullish trend in oil.
- Another interesting thing that just happened is a bullish crossover on the 14 – periods RSI. This also suggests the bullish bias of traders.
Support Resistance
58.46 59.63
57.77 60.1
56.6 61.26
Key Trading Level: 58.93
Crude Oil – Trade Idea
The idea is to place a buy trade above $59 with a stop loss below $58.70 and take profit of around $60.
Good luck!
- Check out our free forex signals
- Follow the top economic events on FX Leaders economic calendar
- Trade better, discover more Forex Trading Strategies
- Open a FREE Trading Account
- Read our latest reviews on: Avatrade, Exness, HFM and XM
ABOUT THE AUTHOR
See More
Arslan Butt
Lead Markets Analyst – Multi-Asset (FX, Commodities, Crypto)
Arslan Butt serves as the Lead Commodities and Indices Analyst, bringing a wealth of expertise to the field. With an MBA in Behavioral Finance and active progress towards a Ph.D., Arslan possesses a deep understanding of market dynamics.
His professional journey includes a significant role as a senior analyst at a leading brokerage firm, complementing his extensive experience as a market analyst and day trader. Adept in educating others, Arslan has a commendable track record as an instructor and public speaker.
His incisive analyses, particularly within the realms of cryptocurrency and forex markets, are showcased across esteemed financial publications such as ForexCrunch, InsideBitcoins, and EconomyWatch, solidifying his reputation in the financial community.
Related Articles

Sidebar rates
Related Posts
