Bitcoin Technical Analysis – Bearish Shark Spotted
BTC/USD traded with a bullish bias over the $4,000 level. Bitcoin is currently trading lower, but dips are likely to find a strong...

[[BTC/USD]] traded with a bullish bias over the $4,000 level. Bitcoin is currently trading lower, but dips are likely to find a strong buying interest near $3,970 or $3,940.
On the hourly timeframe, the leading crypto pair has formed a harmonic pattern called Bearish Shark. It’s a bearish pattern in nature and typically triggers a sell-off in the market. The pattern has completed C to D wave around $4,100 which is now extending a solid resistance. However, the 200 periods moving average prevails around $4040, signaling a bullish bias.
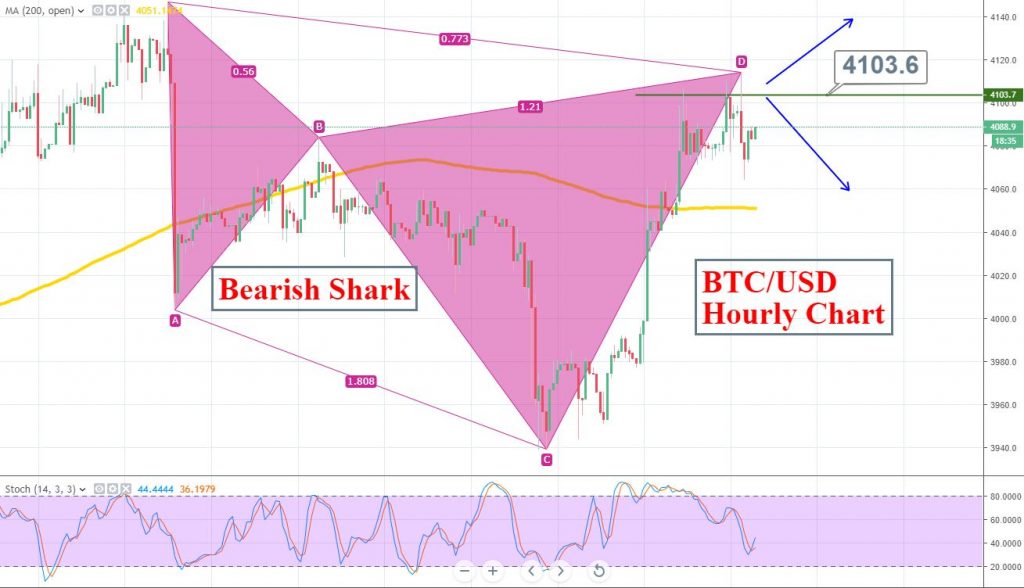
BTC/USD – Hourly Chart
Looking at the chart, Bitcoin price has settled nicely in an uptrend above the $3,970 and $3,960 support levels. Any further drops may push the price back in a bearish zone towards the $3,920 support.
The immediate support is near the $3,940 level, which worked as a major resistance level earlier. Overall, the current technical outlook is positive and there are chances of more gains if BTC breaks above $4,100.
Support Resistance
3977.46 4037.04
3945.29 4064.45
3885.71 4124.03
Key Trading Level: 4004.87
The Stochastic is holding below 50, indicating a bearish bias of traders. So, here’s a thing. BTC/USD is likely to trade bearish below $4,100 with a target of around $3,970 or $3,940. The bullish entries should be preferred on the breakout of $4,100.
All the best!
- Check out our free forex signals
- Follow the top economic events on FX Leaders economic calendar
- Trade better, discover more Forex Trading Strategies
- Open a FREE Trading Account
- Read our latest reviews on: Avatrade, Exness, HFM and XM
Related Articles


Sidebar rates
Related Posts
