Will USD/CAD Reverse Down After This Chart Setup?
USD/CAD has formed a bearish reversing pattern on the H4 time-frame chart.
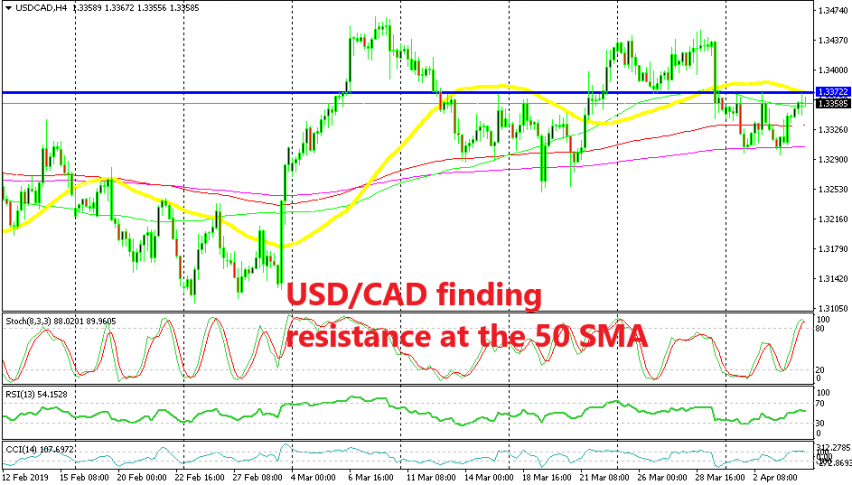
Yesterday, USD/CAD declined lower as the CAD got stronger on increasing crude Oil prices but foiund solid support at the 200 SMA (purple) on the H4 chart. This is the second time this moving averages reverses the price higher, so it has turned into a strong support indicator for this pair.
Today though, this forex pair has been climbing higher, while Oil prices trade sideways. But, we can spot a bearish reversing chart pattern on the H4 time-frame now which might reverse USD/CAD lower again. The 50 SMA (yellow) which has worked as resistance for this pair at the end of February is providing resistance once again.
We also have a resistance level at 1.1370, which is the highest for this week. The stochastic indicator is oversold as well on this time-frame which means that the bullish move is complete now. Besides, the previous H4 candlestick closed as a doji. That is a reversing signal, so we have four technical indicators pointing down for USD/CAD. The risk/reward ratio is pretty good if we place the stop above the 50 SMA and the take profit target at the 200 SMA.
- Check out our free forex signals
- Follow the top economic events on FX Leaders economic calendar
- Trade better, discover more Forex Trading Strategies
- Open a FREE Trading Account