Gold Forms a Bullish Reversing Setup on the Daily Chart
Gold is trading in a wedge and it has formed a bullish reversing pattern on the daily chart now
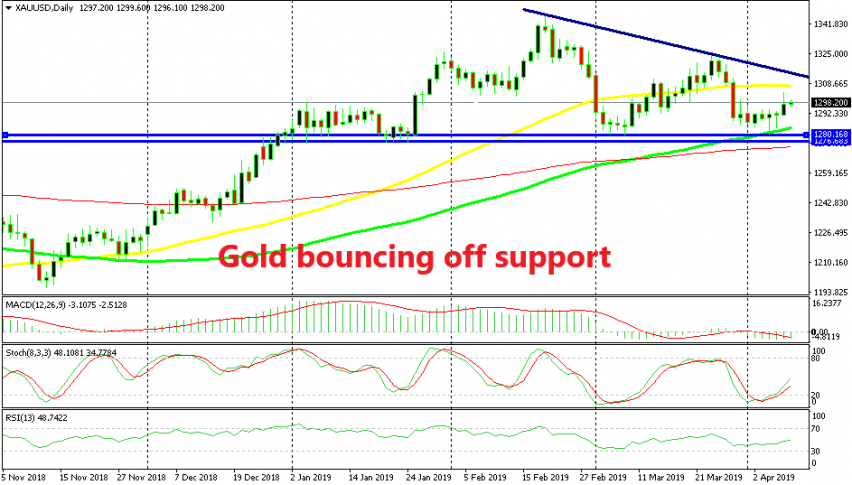
GOLD made quite a bullish move at the end of last year and the beginning of this year. It broke above the big round level at $1,300 and pushed as high as $1,346 in February. But, it reversed after forming an upside-down hammer candlestick on the daily chart and it seems like it has formed a downtrend now.
The highs in March were lower than the highs in February; if the high this month is lower than the high in March and especially if it stays below the descending trend line (dark blue), then Gold traders will be even more convinced about this trend reversal.
But not unless the horizontal lines which have formed a support zone around the $1,276-$1,280 area. Gold bounced again from that support area last week and this time the 100 SMA (green) also added more strength to it. So, right now Gold is trading in a descending wedge.
Gold has formed a bullish reversing chart setup now on the daily time-frame. Last week it formed two doji candlesticks above the 100 SMA and the support zone and yesterday’s candlestick closed pretty bullish. This points higher of course, but we will see if Gold buyers will have enough strength to push above the 50 SMA (yellow) and above the top line of the wedge. If not, then we will try to go short at one of those two indicators above.
- Check out our free forex signals
- Follow the top economic events on FX Leaders economic calendar
- Trade better, discover more Forex Trading Strategies
- Open a FREE Trading Account