Core CPI Slides, U.S. Stocks Open Flat


The U.S. CPI numbers for March came in a bit softer than expected, at least in terms of Core CPI. Stocks have done an about-face in the aftermath, with the DJIA (+35), S&P 500 SPX (+5), and NASDAQ (+10) opening trade moderately in the green. It certainly appears that equities investors are content to wait for today’s FOMC Minutes before taking on any meaningful risk.
Core CPI Numbers Dip In March
While the U.S. CPI for March increased on a monthly and yearly basis, Core CPI didn’t fare so well. Most analysts focus on Core CPI as being the key indicator for inflation, due to the fact it ignores the cost of food and energy. Here is a look at today’s data:
Event Actual Projected Previous
U.S. Core CPI (MoM, March) 0.1% 0.2% 0.1%
U.S. Core CPI (YoY, March) 2.0% 2.1% 2.1%
Both figures disappointed expectations, but only yearly Core CPI fell from previous levels. Judging by these numbers, inflation is near the FED’s 2% target and last year’s rate tightening appears to have been effective.
U.S. Stocks In A Holding Pattern Ahead Of The FOMC
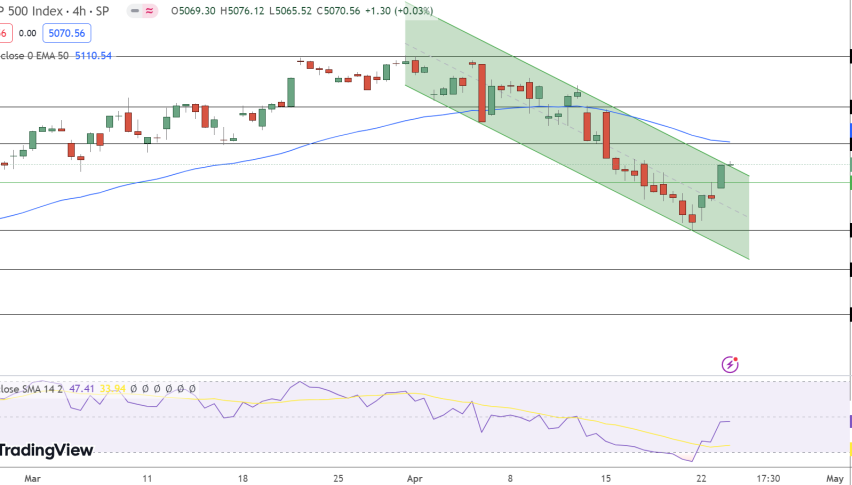
Tuesday brought a significant sell-off in the U.S. indices. Stock prices consistently fell as traders hedged their bets in response to Trump’s tariff threats toward the E.U.
++4_10_2019.jpg)
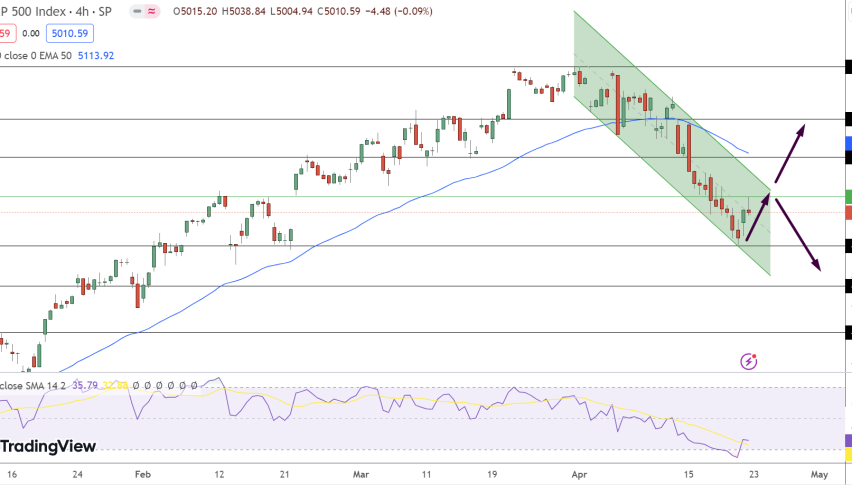
Here are the levels to watch in the June E-mini S&P 500 going into today’s FOMC Minutes:
- Resistance(1): Psyche Level, 2900.00
- Support(1): 38% Current Wave, 2857.75
- Support(2): Bollinger MP, 2840.50
Bottom Line: In the event we see a retracement in the June E-mini S&P 500, I will be looking to go long from the 38% Current Wave retracement. Buys from 2858.75 with an initial stop at 2853.25 produce 50 ticks on a near-1:2 risk to reward management plan.