NZD/USD Finally Reverses at the 50 SMA


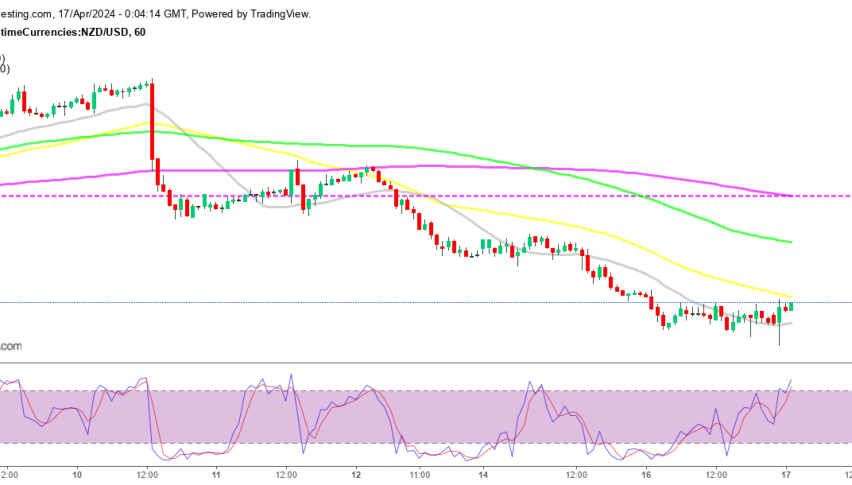
Earlier this week we went long on NZD/USD as this pair was retracing higher. The trend has been pretty bearish for the last three weeks, but the price was retracing higher, so we decided to enter short with the main trend. We based that trade on the H1 chart which was overbought, but now it’s apparent that most traders were trading the H4 time-frame.
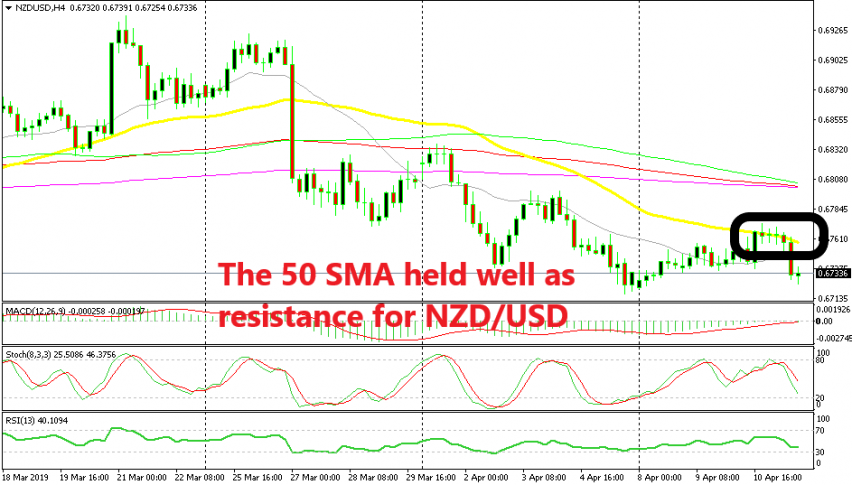
The retrace wasn’t complete on this chart when we opened the sell signal, and the retrace stretched further to the upside. But, we reached the 50 SMA (yellow) yesterday on the H4 time-frame, which has been providing solid resistance in the last few session.
The stochastic indicator became overbought yesterday which meant that the pullback higher was complete and today the reverse lower is taking place as USD bulls regroup again. The price also formed three doji candlesticks on this chart which also pointed to a bearish reversal. Now we are in profit with our signal, so we are holding on to this trade since there’s more room for further profit to the downside.