Weekly Crypto Roundup
The market looks very bullish, although Bitcoin is currently in a consolidation phase

The market looks very bullish, although Bitcoin is currently in a consolidation phase with a volatility of 11.50 percent this week. There are several factors to consider when it comes to the question of whether the cryptocurrencies bear market has come to an end or new lows are yet to come. With the current outlook, a short-term correction seems very likely. So without further ado, let’s dive right into the technical analysis of Bitcoin, Ethereum and the total market capitalization.
BTC/USD WEEKLY CHART
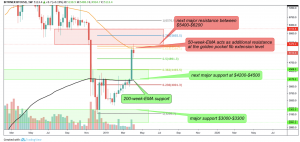
When looking at the bigger picture, Bitcoin was rejected by the resistance at $5400-$5500 so far. This is not necessarily bearish, as a correction wave was overdue after the steep increase in price during last week. The next major support is found at $4200-$4500 where the 0.382 fib extension level and the 200-week-EMA act as additional support. On the other hand, if Bitcoin manages to break the 50-week-EMA and golden pocket fib extension resistance, a re-test of the $6000 mark should follow as a consequence.
BTC/USD 4H CHART
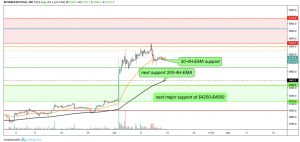
The 4-hour chart is a very important chart to look at right now. The 50-EMA currently acts successfully as support and once it is bearishly broken, Bitcoin finds its next support at $4600, where the 200-EMA is located at.
BTC/USD 4H CHART
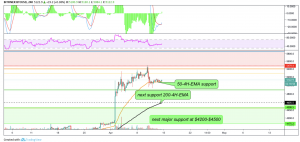
While Bitcoin declined nearly ten percent after a bearish divergence occurred in the RSI, the MACD indicates bullishness. In fact, the MACD lines crossed bullishly and the histogram is ticking higher.
BTC/USD 4H CHART
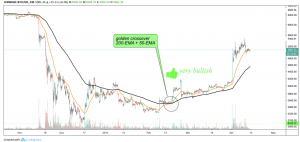
What’s very interesting is the fact that a golden crossover appeared in the H4 chart of Bitcoin at the price of roughly $3600. A golden crossover describes the event of the 50-EMA surpassing the 200-EMA and is considered very bullish. Additionally, the volume increased significantly during this current uptrend which is also very bullish.
Once this happens in the daily chart, we can assume the end of the bear market. The EMAs will most likely touch each other when Bitcoin is heading towards the $6000 mark. Either the 50-day-EMA gets rejected by the 200-day-EMA or the market turns fully bullish again.
ETH/USD DAILY CHART
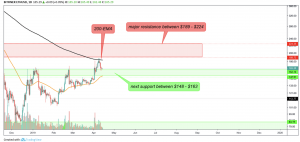
Ethereum was bearishly rejected by the 200-day-EMA and is currently in support region. Thus, Ethereum shouldn’t fall below the 50-day-EMA at $150 to remain bullish. For now, it seems likely that Ethereum will re-test the 200-day-EMA resistance in the upcoming weeks.
TOTAL MARKET CAPITALIZATION
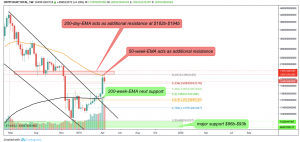
The total market capitalization of the cryptocurrency market faced rejection at the 50-week-EMA which is located at the very important key resistance at $180b. The market could either hold its current level above the 0.236 fib level or decline all the way down to the 0.382 fib level at $148b. This would be very bullish, however, if bearishly broken, the total market capitalization finds its next support at the 200-week-EMA, which is located at the golden pocket. A bounce off this level would also be very bullish.
Therefore, chances are high that bullish months are ahead. In fact, the strong increase in volume is very bullish.
The biggest gainers of this week were
LAMBDA, which surged by 260 percent,
CRO, which rose by 112 percent, and
DNT, which gained by 42 percent.
News of this week was that South Korea’s crypto regulations reportedly will not require sandbox approval and that Youtube’s biggest channel with more than 94m subscribers, PewDiePie, announced that he will move to DLive, a blockchain based platform, to publish live streams and similar content for his fans.
- Check out our free forex signals
- Follow the top economic events on FX Leaders economic calendar
- Trade better, discover more Forex Trading Strategies
- Open a FREE Trading Account