Bitcoin Finally Breaks the 200 SMA and the Resistance at $5,300
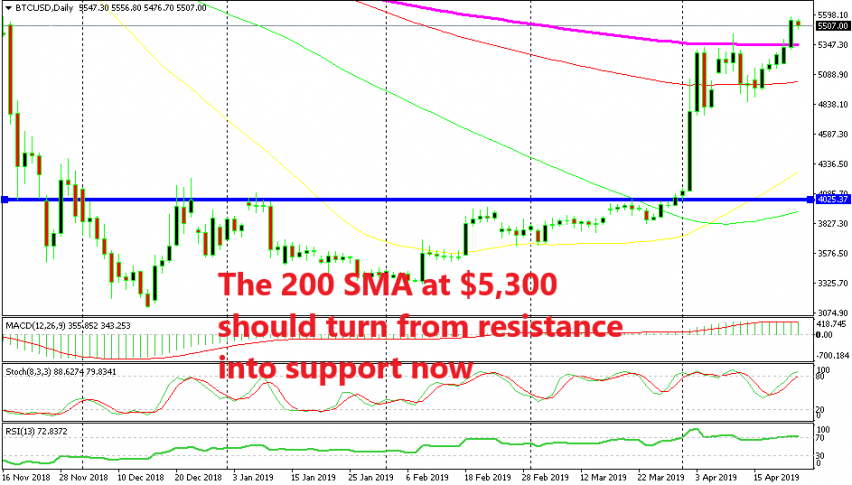
Cryptocurrencies turned bullish at the start of this month and BITCOIN finally broke above the $4,000 level which had turned into resistance for several months. The price surged around $1,000 higher in the next few sessions, but it failed to take out the 200 SMA (purple) on the daily chart.
That moving average turned into resistance for Bitcoin now and it lasted more than two weeks. A resistance level also formed up there at $5,300. During this time, the area around the 100 SMA (red) turned into some sort of resistance zone.We have seen the buyers pierce the price once and push to $5,435, but then it pulled back inside the range.
Although, the break finally came yesterday. The 200 SMA was finally broken and the price reached $5,566 on my platform. This break was as important as the break of the $4,000 level. Now it opens the door for $6,000 and perhaps more, but I think that the $6,000 level will be a tough challenge since it was a strong support on the way down. But first, let’s see how and when Bitcoin will make its way up there. Now the pullbacks to the 200 SMA at $5,300 should be seen as buying opportunities.


