Weekly Crypto Roundup
The market had ups and downs this week, although the prospects were very bullish at first.

The market had ups and downs this week, although the prospects were very bullish at first. Bitfinex’s tether caused fud (fear, uncertainty, doubt) which put a spoke in Bitcoin’s wheel and caused the uptrend to come to an end very quickly. However, the market recovered already and there are still chances of a potential re-test of the $6000 range. To find out what the chances are to break out bullishly or bearishly, we will take a look at the technicals of Bitcoin, Ethereum and the total market capitalization.
It’s important to note that Bitfinex pairs are currently at a premium again. This means Bitfinex pairs are valued higher than the pairs of the other exchanges.
USDT/USD WEEKLY CHART
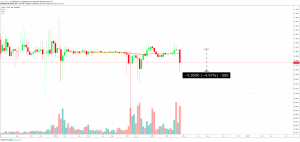
This is due to the fact that the tether value (a stable coin by Bitfinex) dropped by five percent during last week. The reason for this was negative headlines such as that “Bitfinex Covered $850 Million Loss Using Tether Funds, NY Prosecutors Allege”, according to CoinDesk. It’s official now that tether is not 100 percent backed by USD. It might be recommended to use a different stable coin such as true USD (TUSD).
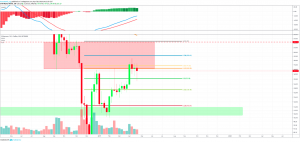
BTC/USD BITFINEX DAILY CHART
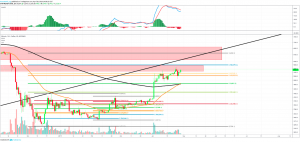
Bitcoin was not rejected by the golden pocket fib extension level, which is bullish so far. In fact, Bitcoin found support at the golden pocket and is now in a resistance area between $5450-$5800. The 200-day-EMA and the 50-day-EMA performed a bullish crossover, which could mark the beginning of a new bull market. However, Bitcoin needs to break three major resistances up to $6800. The 3-year-trendline acts as significant resistance at the major resistance level between $6000-$6800. If bullishly broken in a weekly or monthly candle, resulting in the $6000 mark and trendline resistance becoming support again, we can assume the end of the bear market for Bitcoin. For now, Bitcoin finds its next support at the two EMAs and at the major support level between $4200-$4500. As long as this support level holds, we can expect a re-test of the $6000 mark. While the MACD lines are still bearish, the histogram ticks higher which indicates bullishness.
BTC/USD COINBASE DAILY CHART
When looking at a chart by Coinbase, Bitcoin is located at $5200 and has recovered only slightly from the major decline. This is due to the fact that Bitfinex pairs are currently at a premium, because tether dropped in value versus USD.
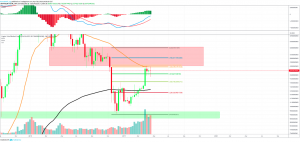
BTC/USD COINBASE WEEKLY CHART
In fact, Bitcoin was rejected by the 50-week-EMA so far. This resistance is very strong which is why Bitcoin was rejected by it the last four weeks. Once bullishly broken, we can assume a re-test of the $6000 mark. If not bullishly broken, a decline to the support level between $4200-$4500 is likely.
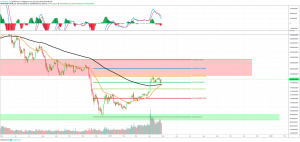
ETH/USD BITFINEX WEEKLY CHART
Ethereum was rejected by the golden pocket fib extension level which is a very bearish sign. With it currently ranging between the golden pocket resistance and the 0.5 fib extension support, Ethereum might either find support at the 0.5 fib level or at the 0.382 fib level at $136. If both are bearishly broken, Ethereum finds major support around the $100 mark. For now, Ethereum is facing a major resistance between $169 and $220. Ethereum needs massive volume to break this resistance area. For now, it seems likely that Ethereum is heading towards the $130 mark. Furthermore, while the MACD lines are still bullish, the histogram is ticking lower which is also a bearish sign.
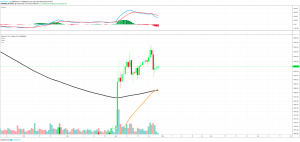
TOTAL MARKET CAPITALIZATION/ USD WEEKLY CHART
The cryptocurrencies market faced harsh rejection at the 50-week-EMA which is located at the exact same level as the golden pocket fib extension, at $178b-$180b. The MACD’s histogram is also indicating bearishness. With the current outlook, the cryptocurrency market might find support at the 0.5 fib extension level at $162b. If this level fails to hold, the crypto market finds three supports beneath – a minor support at $146b, the 200-week-EMA support at the 0.236 fib extension level between $126b-$133b and major, and a strong support at the $100b mark. With it facing multiple resistances above $178b, the cryptocurrency market needs an incredibly high volume to break the resistances.
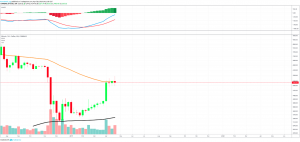
TOTAL MARKET CAPITALIZATION/ USD DAILY CHART
The bullish crossover in the daily chart still gives hope to see further upward movement and acts as strong support for now. With the ranging between this support level and the golden pocket fib extension level, the market has to decide where it is going next. The MACD lines are still bearishly crossed but the histogram is ticking higher, which is bullish. If the market doesn’t manage to break the golden pocket level, we might see heavy downward movement very soon.
To conclude, the market looks quite bearish. The bulls still have a chance to see a major upward movement, but for now, it seems rather unlikely. The market might decline further.
A very bullish news of this week was that according to Nathaniel Popper, a technology reporter of the New York Times, e-trade is preparing to offer Bitcoin and Ethereum markets for its five million clients.
- Check out our free forex signals
- Follow the top economic events on FX Leaders economic calendar
- Trade better, discover more Forex Trading Strategies
- Open a FREE Trading Account