Shorting Bitcoin As It Reaches the Support at $6,000
Bitcoin has made another jump today and has reached $6,000, but this is a major support and resistance level
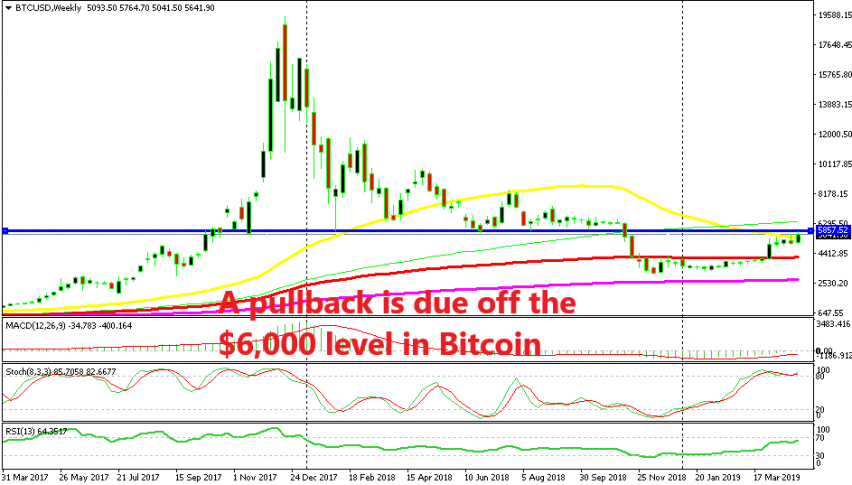
Cryptocurrencies have been on a bullish trend since the beginning of this year following the reversal after being on a major downtrend for more than a year. BITCOIN broke above the 100 SMA (red) on the weekly time-frame chart which comes just above $4,000, which in itself turned into a resistance zone for some time.
The $5,000 level didn’t do as much as some traders might have hoped in terms of resistance and it was broken quite easily. This week we are seeing Bitcoin make another bullish move and the price has finally reached the level everyone has been looking at for some time.
That level is the zone around $6,000 which provided solid support to Bitcoin throughout last year until it was broken at the end of 2018. The weekly chart is now overbought as the stochastic indicator shows and the last three candlesticks closed as upside-down hammers which are reversing signals.
So, I decided to go short on Bitcoin again, hoping to get some pips on a rejection at$6,000. My colleague thinks that the upside will continue and that might be true, but a retrace lower, at least to $5,000 is due now, especially if this week’s candlestick closes below the 50 SMA (yellow). So, hoping for a pullback now. If it happens, Bitcoin might dive as deep as $4,000 where the 100 SMA (red) lies.
- Check out our free forex signals
- Follow the top economic events on FX Leaders economic calendar
- Trade better, discover more Forex Trading Strategies
- Open a FREE Trading Account
- Read our latest reviews on: Avatrade, Exness, HFM and XM
Related Articles


Sidebar rates
Related Posts
