EUR/USD Having Trouble Overcoming the 100 SMA
EUR/USD popped higher yesterday after breaking above 1.12, but it can't break the 100 SMA on the H4 chart
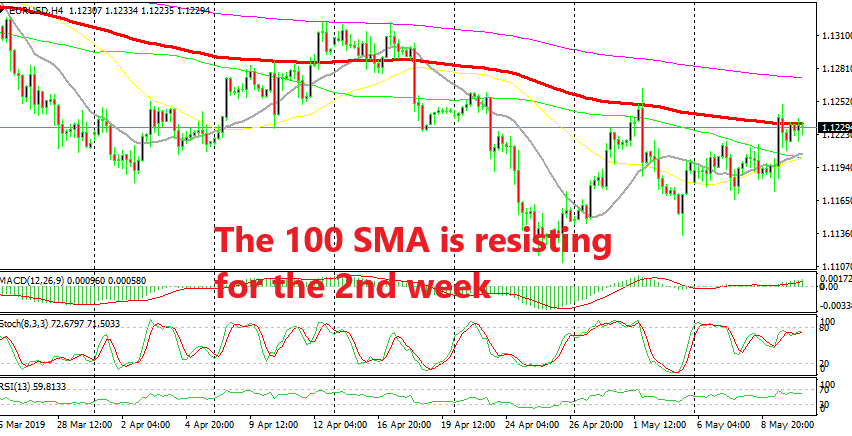
[[EUR/USD]] made a jump yesterday to 1.1250 after breaking the 200 SMA (purple) on the H1 chart which had been providing resistance all this week. The push above the the 200 SMA and above the 1.12 level triggered some weak stops which sent this pair popping 60 pips higher.
But on the H4 time-frame chart, the buyers have been having trouble pushing above the 100 SMA (red) since yesterday. This moving average got pierced but it didn’t get broken, and the price is still trading below it. In fact, the 100 SMA has provided support and resistance several times before, last week being the last time as the chart above shows.
Now the stochastic indicator is near the overbought area which means that the retrace higher is complete and the main trend is still down. Although, the price is sticking to the 100 SMA which a sign that sellers haven’t regrouped yet. So, the chart points to a bearish reversal. But watch the price action if you want to trade this trade setup. If buyers can’t push above soon and hold the price there, then the reversal should come.
- Check out our free forex signals
- Follow the top economic events on FX Leaders economic calendar
- Trade better, discover more Forex Trading Strategies
- Open a FREE Trading Account
- Read our latest reviews on: Avatrade, Exness, HFM and XM
Related Articles


Sidebar rates
Related Posts
