The 50 SMA Turns From Resistance Into Support for AUD/USD
[[AUD/USD]] has been on a bearish trend for a long time on larger time-frame charts, but the downtrend picked up pace since the middle of last month as the trade war between US and China escalated. That hurts the Australian Dollar both ways; first, the sentiment turned negative on increasing trade tensions which hurts risk assets such as commodity Dollars and second, the Australian economy gets affected negatively by the slowdown in China.
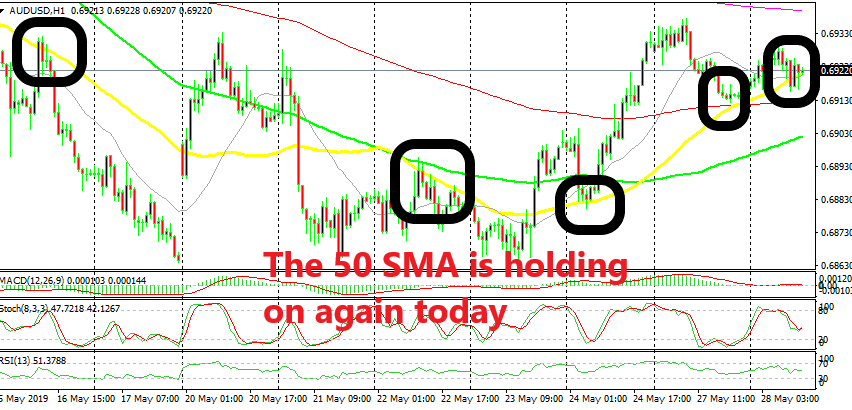
Although, at the end of last week AUD/USD made a bullish move higher after the really weak economic data we saw from the US on Thursday. On the way down, the 50 SMA (yellow) was providing resistance for this pair as you can see from the H1 chart above, but the price broke above that moving average and above the other MAs.
Once broken, the 50 SMA turned into support, which is a sign that the pressure has changed to the upside now. The 50 SMA provided support on Friday, it did so yesterday and it is providing support again today. So, this moving average is defining the downside for AUD/USD and until the 50 SMA remains as support, this pair will remain bullish. Only when the 50 SMA breaks will the downtrend resume again. So, let’s watch the price action until that happens.


