WTI Crude Oil Finally Breaks the Triangle
Crude Oil has finally broken the triangle that MAS formed yesterday
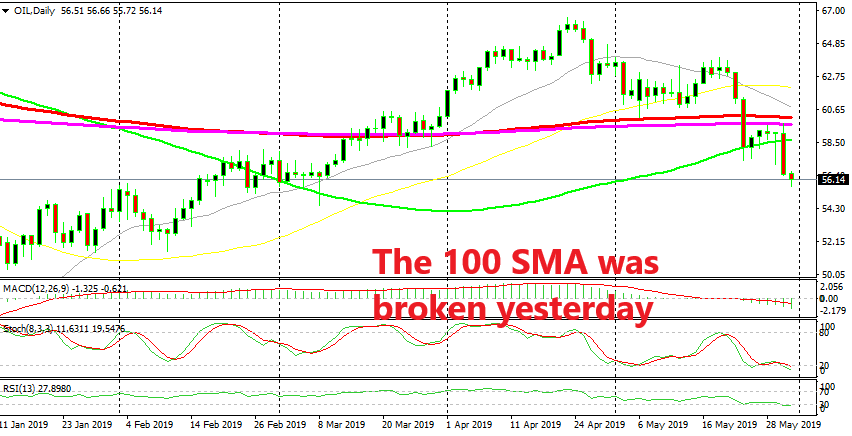
US Crude Oil turned bearish at the end of last month at $66.50 after it formed a couple of morning star/spinning top candlesticks up there, which are reversing signals like the dojis and pins. The price found support at the 100 SMA (red) and the 50 SMA (yellow) in the first two weeks of this month and retraced higher.
But that weak bullish move ended just below the $64 level and the bearish trend resumed after forming a few doji, spinning top candlesticks. The fall which followed those candlesticks was pretty deep and WTI crude lost around $7 dollars on that decline. The price broke below all moving averages but it didn’t close below the 100 simple MA (green), so that last break doesn’t count until Crude Oil closes a daily candlestick clearly below it.
This moving average has been pushing the price higher this week despite being pierced a few times and the daily candlesticks have been getting smaller and smaller. The range has been tightening as Oil advances towards the tip of the triangle that the moving averages have formed. Although, the pressure remains on the bottom side and the 100 SMA (green) has been broken.
That would be a good moment to sell WTI crude with a stop above the 200 SMA. Now the door is open for the $50 level.
- Check out our free forex signals
- Follow the top economic events on FX Leaders economic calendar
- Trade better, discover more Forex Trading Strategies
- Open a FREE Trading Account


