Bitcoin Heads for $10,000 as the 50 SMA Catches Up
Bitcoin has shifted the trend and it is now targeting the $10,000 level

Last year was pretty horrible for cryptocurrencies as they plunged lower after a really stellar year in 2017. 2017 was really great for altcoins, but everyone could feel that the surge that year wasn’t real or sustainable. Digital currencies climbed to fast too quickly, with BITCOIN surging over 1,000% in a few months, climbing from around $2,000 to $20,000. Other smaller altcoins increased their value even more compared to their initial value.
But the crash lower in 2018 was just as quick and Bitcoin fell close to the $3,000 level. On the way down, there were some major levels which did provide some sort of support, such as the big round level at $10,000 and the $6,000 level. But they were broken at some point and the bottom for Bitcoin was put in place at the end of last year right above $3,000.

The 100 SMA (green) did a great job in stopping the decline for Bitcoin
Why there? No one knows exactly why Bitcoin stopped surging in 2017 just below $20,000 or why the decline stopped above $3,000, but one indicator is the 100 SMA on the weekly chart. Bitcoin found support at this moving average last December and again in February, so it was pretty clear that the decline was over. Bitcoin and other cryptos started crawling higher and in April, it jumped more than $1,000 higher. But, it still wasn’t clear if the trend had shifted into bullish or this was just a retrace higher, because Bitcoin was finding resistance at the 50 SMA (yellow) and the price formed a few doji candlesticks on the daily chart, which are bearish reversing signals after the climb.
The 50 SMA has caught up with the price already
Although, the bullish move resumed again and the 50 SMA was finally broken. Now that was the signal that the trend had changed for Bitcoin and cryptocurrencies in general since they usually move as a group. There was a big chance that the $6,000 level could provide some decent resistance since it did provide strong support on the way down for many months in 2018. But, that level was broken as well and the bulls gained the confidence they needed to bring the uptrend back in play for all altcoins.
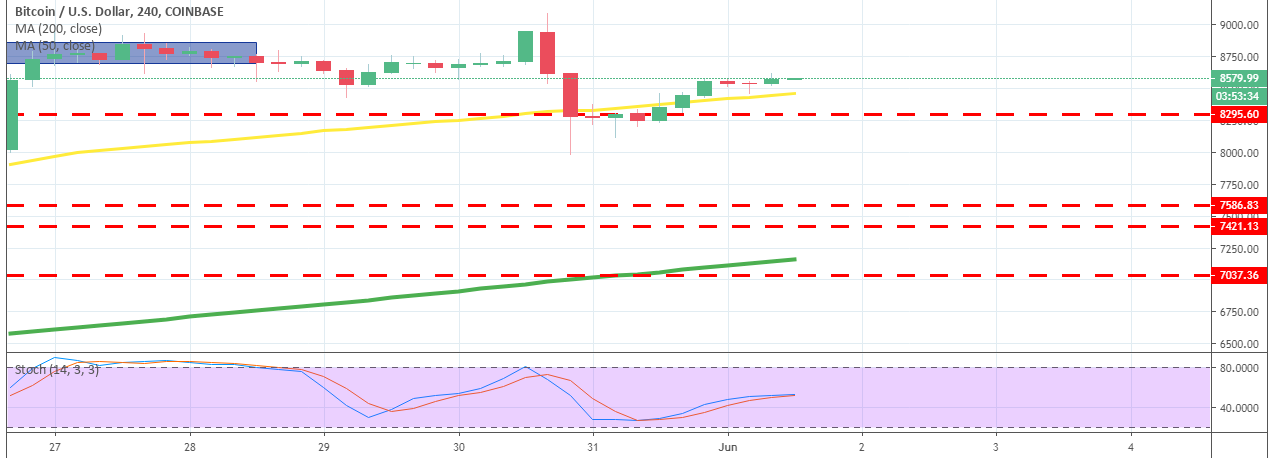
Now, the target for Bitcoin is the $10,000 level. The price pierced the $9,000 level, but has slipped back to $8,500s now, although this looks just like a pullback before the next assault to the top side again. When that attack comes from the buyers, the next target for Bitcoin will be $10,000. Actually, the pullback down might be complete now that the 50 SMA (yellow) has caught up with the price on the H4 chart.
This moving average has been pushing Bitcoin higher in the last few months. Bitcoin makes a move higher, waits for the 50 SMA to catch up, trades around (above and below) it for some time and then comes the next bullish move. We have seen this scenario take place several times during this period, so the logic tells us that now that the 50 SMA has caught up with the price again, Bitcoin will make another bullish move, which usually spills in the rest of cryptos. This might as well be a good chance to go long on Bitcoin.
- Check out our free forex signals
- Follow the top economic events on FX Leaders economic calendar
- Trade better, discover more Forex Trading Strategies
- Open a FREE Trading Account
- Read our latest reviews on: Avatrade, Exness, HFM and XM
Related Articles


Sidebar rates
Related Posts
