Gold Breaks Both Sides of the Wedge but Returns Back in
Gold has been trading in a triangle for a few weeks until Wednesday evening when the FED sent the price lower, breaking the triangle
GOLD was on a bullish move until yesterday in the evening after the FED meeting which reversed the price lower. The bullish move started at the end of May, as you can see from the daily chart below, which turned into a surge in June and Gold climbed more than $170 in total.
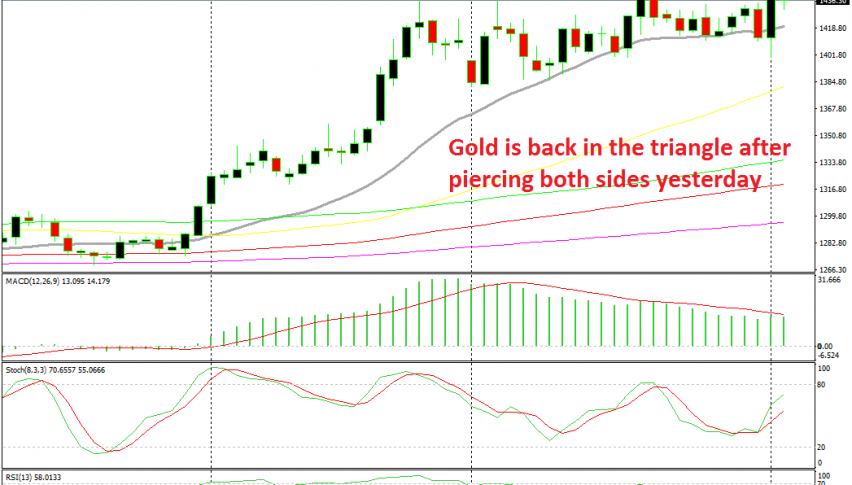
In July the trend slowed and the 20 SMA (grey) caught up with the price in Gold. This moving average turned into support for Gold, while the previous resistance at $1,440 formed a line which turns this into a wedge or a closing triangle. Two days ago I highlighted this triangle in Gold, which could have been broken in either direction.
Now we see that Gold has broken the triangle on both sides. First it was the 20 SMA to be broken to the downside, then we saw a reversal after Trump announced new tariffs on China and the resistance at $1,440 was broken. but the price returned back down and now Gold is back inside the wedge. So, back to trading the wedge, buy at the 20 SMA and sell at around $1,440.
- Check out our free forex signals
- Follow the top economic events on FX Leaders economic calendar
- Trade better, discover more Forex Trading Strategies
- Open a FREE Trading Account