That was it for the Pullback in USD/JPY as the 20 SMA Turns From Support Into Resistance
USD/JPY turned bearish on Thursday last week after the FED meeting on Wedensday evening. The FED cut rates by 0.25% which sent USD/JPY 80 pips higher, given that the FED didn’t leave the door open for further rate cuts in the coming months, but started reversing the following day when Donald Trump tweeted about more tariffs on China.
That killed the positive sentiment in financial markets and safe havens benefited from that as they usually do when the sentiment is negative. GOLD has surged to 6-year highs while USD/JPY lost nearly 400 pips in a few days. So, this month started pretty bearish for this pair.
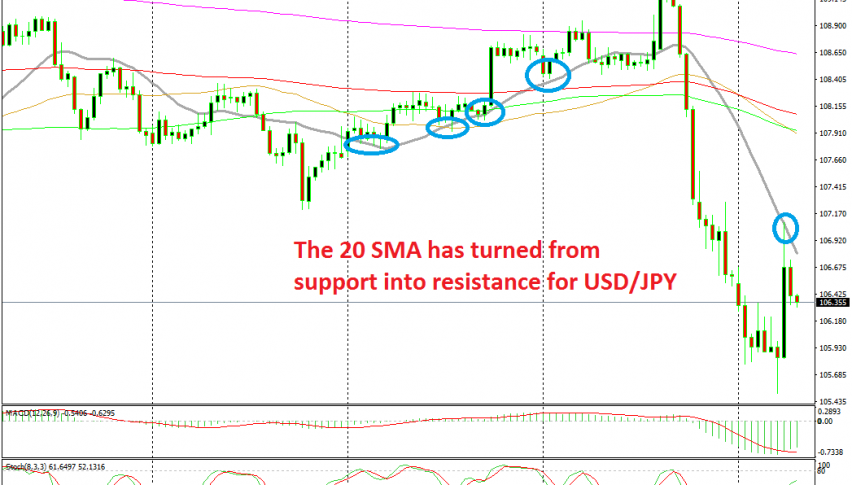
Although, we saw a bullish retrace higher during the Asian session this morning after some impressive income and spending figures from Japan which improved the sentiment for this pair. The price retraced more than 150 pips higher in a few hours, but it ran into the 20 SMA (grey) on the H4 chart.
This moving average was providing support in the last two weeks as this pair was climbing higher,now it seems to have turned into resistance. We missed the chance to go short from this moving average since it was too early for me when USD/JPY reached it, but it remains a good indicator to short this pair from.


