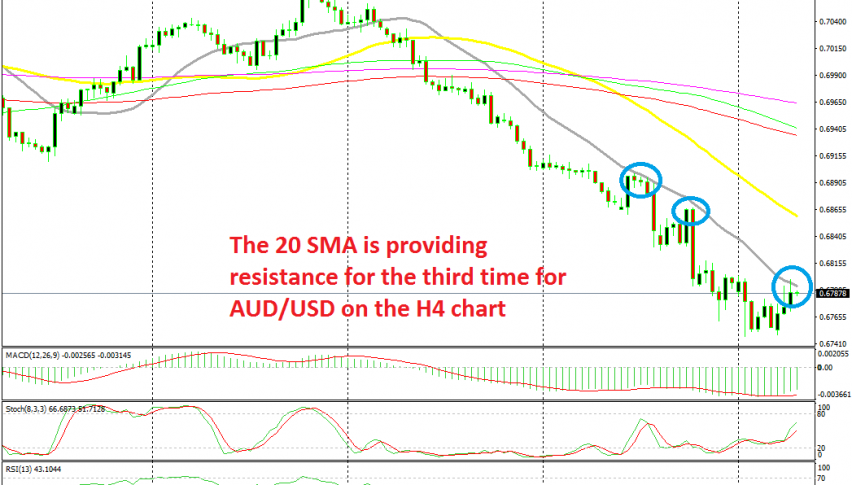
The Retrace Should be Complete for AUD/USD at the 20 SMA
AUD/USD has been really bearish recently but yesterday we saw a decent pullback, taking us tot he 20 Sma on the H4 chart

[[AUD/USD]] has been on a really strong trend during the last two weeks, losing around 330 pips from top to bottom. The downtrend has been defined by the 20 SMA (grey) and the 50 SMA (yellow) on the H1 chart, as we have been showing in the last several days. We have opened a few sell signals based on the H1 chart, all of which hit take profit, apart from the one we opened yesterday.
Yesterday we opened another sell signal as this pair was retracing higher. The price reached the 20 SMA on the H1 chart yesterday and it formed a doji candlestick on that time-frame, which is a reversing signal. Stochastic was also overbought so we decided to take another shot at the short side on this pair.
But, the escalating trade war is proving to be negative for the USD and the retrace stretched further to the upside. The price broke above the 20 SMA and the 50 SMA on the H1 chart and this morning AUD/USD touched 0.68. But, that’s where the 20 SMA comes on the H4 chart, as you can see from the image above.
This moving average has provided resistance a couple of times last week and it seems like it is doing the same job again now as AUD/USD is reversing down from there. Our signal is safe for now, although the situation has become a bit complicated now for this pair.
The AUD is bound to be bearish for a long time as the trade war hurts the Aussie more than anything else, but the USD is bearish as well now. Let’s see which one will be the weakest. If the Aussie wins the battle of the weak, then the bearish trend will resume again.
- Check out our free forex signals
- Follow the top economic events on FX Leaders economic calendar
- Trade better, discover more Forex Trading Strategies
- Open a FREE Trading Account


