Gold Facing the 50 SMA Again As it Reverses Lower
Gold has been really bullish recently but it has retraced lower today and it is finding support at the 50 SMA now
Gold has ben on a strong bullish trend, although the climb stalled at the big resistance level at $1.440 for several weeks in July. The price traded in a range during last month, but the lows were getting higher which was a sign that the resistance was going to be broken at some point.
On the daily chart, the 20 SMA (grey) was providing support during July, pushing the lows higher. But the big break came only this month after Donald Trump announced new tariffs on China which turned the sentiment negative in financial markets, sending safe havens such as Gold and the JPY surging.
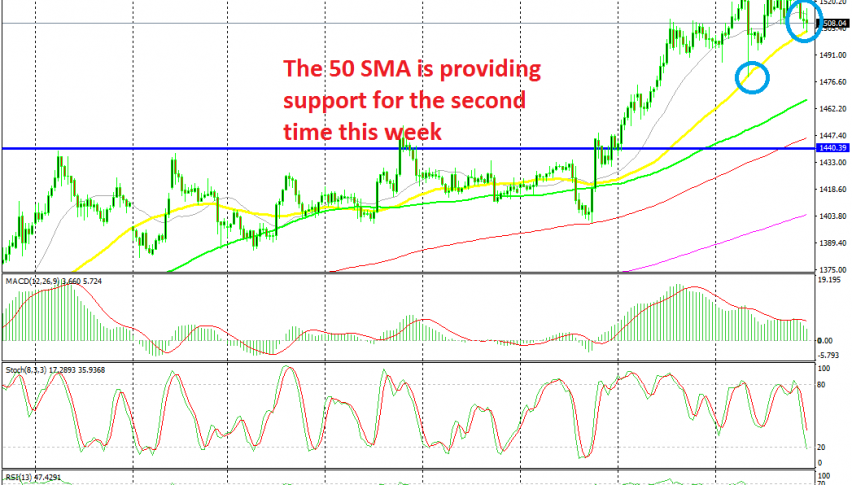
Gold climbed from $1,400 in the fisrt day of August to $1,535 early this week. Moving averages have been helping Gold as well on the H4 chart, providing support on pullbacks lower. The 20 SMA (grey) provided support at the start of this week and again yesterday on shallower pullbacks. But on deeper pullbacks the 50 SMA (yellow) has come into play.
This moving average provided support on Tuesday and it seems like it is doing that job again now. The price has formed two doji candlesticks after the pullback lower today, so it seems that the 50 SMA is already providing support. The stochastic indicator has become overbought now, so there is a good chance that we see a bounce higher from here.
- Check out our free forex signals
- Follow the top economic events on FX Leaders economic calendar
- Trade better, discover more Forex Trading Strategies
- Open a FREE Trading Account
- Read our latest reviews on: Avatrade, Exness, HFM and XM
Related Articles


Sidebar rates
Related Posts
