Weekly Crypto Roundup

Bitcoin and the cryptocurrency market might go for a minor upswing this week. With them currently being in major support zones, chances are that the support will hold and a small uptrend will follow. Let’s look at the technicals of Bitcoin, Ethereum, Ripple and Litecoin.
BTC/USD DAILY CHART
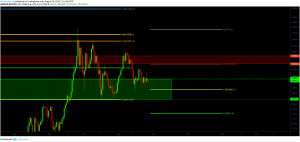
Bitcoin is still in a strong support zone and looks good to go for a small uptrend towards the 0.236 fib resistance at $11,260. As long as Bitcoin holds above $9,135 it will probably go for a re-test of the $11,500 resistance. Once surpassed, the next resistance is at around $14,000. In case of a bearish break of the major support between $9,135 and $9,500, Bitcoin will most likely retrace down to its golden ratio support between $6,800 and $7,200.
ETH/USD DAILY CHART
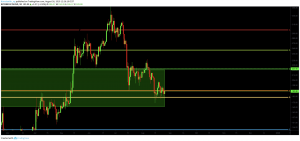
Ethereum is exactly at the golden ratio support, which held successfully so far. Ethereum is currently in strong support regions up to $222 and it looks good for a small rise towards the $220 mark. After that, Ethereum finds its next resistance at the 0.382 fib level at $257. If Ethereum’s current support fails to hold, it finds the next major support around $140. But for now, it seems likely that Ethereum is rising in the short-term.
XRP/USD DAILY CHART
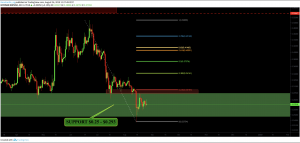
XRP is still in strong support regions and currently at a historical low. It finds its next resistance at around $0.30, where the 0.236 fib level acts as additional resistance. For now, it seems likely that XRP will continue to range between $0.25 and $0.30.
LTC/USD DAILY CHART
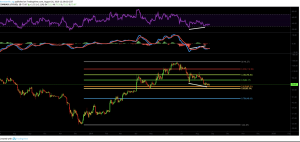
All technical indicators point towards a rise towards the $100 mark for LTC. In fact, LTC finds strong support between $65 and $70 at the golden ratio level where it is currently located at. The daily RSI as well as the MACD show a bullish divergence which hints that LTC is about to rise significantly in the near term.
The biggest gainers of last week were
WAN, which surged by almost 120 percent,
DOCK, which gained by 112 percent, and
FUN, which rose by almost 50 percent.
- Check out our free forex signals
- Follow the top economic events on FX Leaders economic calendar
- Trade better, discover more Forex Trading Strategies
- Open a FREE Trading Account
