Crude Oil’s Symmetric Triangle Intact – Thin Volatility Plays
Crude oil is trading bullish at 56.15 but the bullish trend is restricted by symmetric triangle pattern which is extending resistance...
What’s up, traders.
August’s thin trading volume is driving no major moves in the market. Most investors are out on summer vacations, resulting in a lack of trading volume. It’s also impacting the crude oil price movement. On Thursday, crude oil prices traded slightly bullish due to the sharp fall in the US inventories last week.
As per EIA (Energy Information Administration, American crude inventories fell last week by 10M barrels, while gasoline and distillate stocks each declined by 2.1M barrels. The data was well expected, especially after the API said US crude stocks had fallen by 11.1 million barrels last week. With that, investors are trading crude oil with a bullish bias.
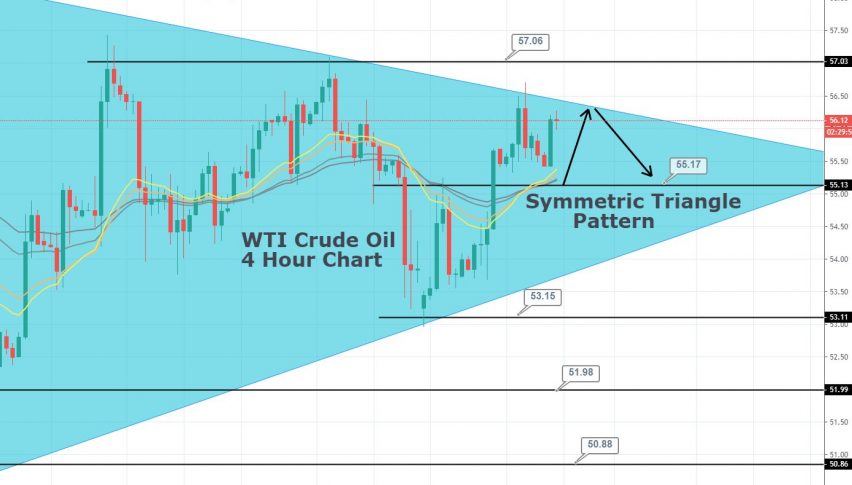
WTI Crude Oil – Technical Outlook
On the technical side, crude oil is trading bullish at 56.15 but the bullish trend is restricted by symmetric triangle pattern which is extending resistance around 56.50 area. Next resistance stays at 57.
On the lower side, series of 20, 40 and 50 periods EMA’s are extending support around 55.15. In case of a bearish breakout, we may see the pair dropping towards 54 and 53.12.

WTI Crude Oil – Technical Levels
Support Resistance
55.2 56.57
54.55 57.3
53.18 58.68
Key Trading Level: 55.93
WTI Crude Oil – Trade Plan
Let’s keep an eye on 55.90 as oil may continue to trade bullish above this level, whereas, we may see sell-off below the same level. I will be looking to target 40 pips on both sides.
Good luck!
- Check out our free forex signals
- Follow the top economic events on FX Leaders economic calendar
- Trade better, discover more Forex Trading Strategies
- Open a FREE Trading Account