Gold Heads for the 50 Daily SMA
Gold has been really bullish in the last three months, but it has reversed down now and it broke the 20 SMA
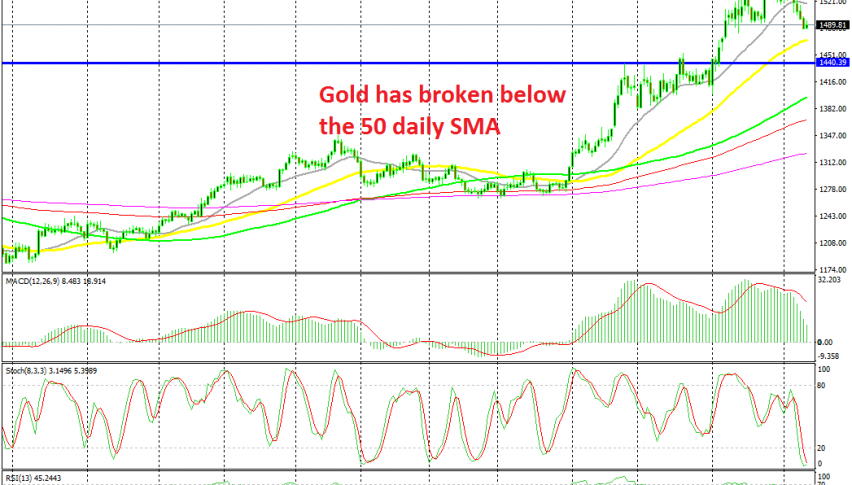
GOLD has had a really great year since August 2018. It has climbed around $400 from the bottom. The best times came since June started this year, with Gold absolutely surging in the last three months as the sentiment turned really negative in financial markets due to the escalating trade war.
The smaller period moving averages come into play when the trend get strong and we can see that the 20 SMA (grey) provided support in the last three months when Gold was surging. The previous resistance level at $1,440 was broken at the beginning of August and Gold reached as high as $1,557 early this month.
But, in the last week or so, Gold has reversed down as the sentiment improves in financial markets. The 20 SMA has now been broken, which shows that the great times are over for Gold, for now. Gold seems to be headed for the 50 SMA (yellow) now on the daily chart. We will see how the price acts down there and if we see a bullish reversing pattern and a signal such as a doji/pin candlestick, then we might go long on Gold from there.
- Check out our free forex signals
- Follow the top economic events on FX Leaders economic calendar
- Trade better, discover more Forex Trading Strategies
- Open a FREE Trading Account