Playing the Range Between 2 MAs in EUR/GBP
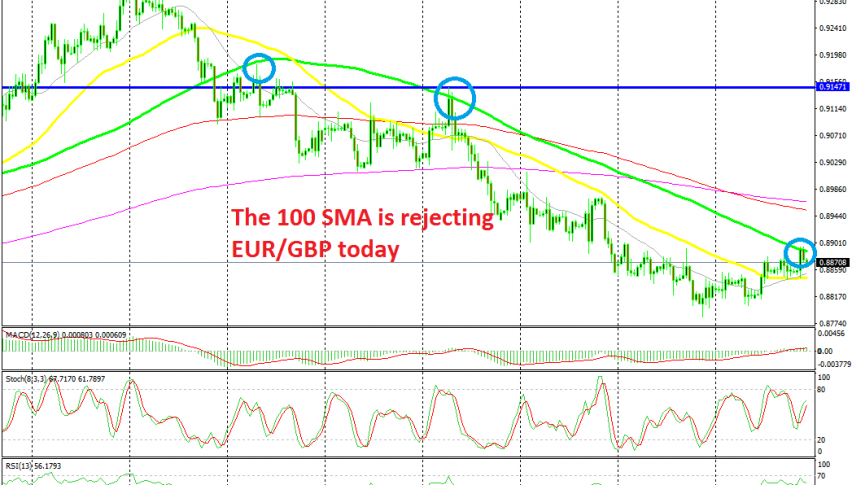
EUR/GBP has ben on a bearish trend for nearly two months, since it reversed at 0.9320s. Since then, the traffic has been on one direction only and this pair lost around 550 pips from top to bottom. During this time, the 20 SMA (grey) and the 50 SMA (yellow) have been providing resistance on retraces higher and the 100 SMA (green) took up that job once.
Although, the price has turned bullish this week, as the GBP turned bearish on increased uncertainty regarding British politics. EUR/GBP broke above the 20 SMA and the 50 SMA, but the buyers couldn’t push above the 100 SMA on the H4 time-frame chart.
This moving average has been providing resistance for the last several hours, so we decided to open a sell signal from there. This chart is almost overbought as the stochastic indicator shows, so a reversal should take place soon. The 50 SMA has turned into support this week, so it’s not certain whether sellers will push back below it. But, the 50 SMA will be enough for our trade, since the distance between the 2 MAs is around 45 pips.


