GBP/USD Faces MAs After Climbing Higher on the Q2 GDP Report
The final reading for Q2 GDP in UK was released a while ago. Q2 remained unchanged at -0.2%, which means that the British economy contracted by 0.2% in that quarter. But the YoY GDP number was revised higher to 1.3% from 1.2% previously estimated.
The deficit in the current account for Q2 came in higher at -25B against -19.2B expected. Q1 was also revised lower to -33.1B from -30B. Business investment for Q2 was revised a tick higher, showing a 0.4% decline, compared to -0.5% in the previous estimate, so that’s still a contraction despite the revision higher.
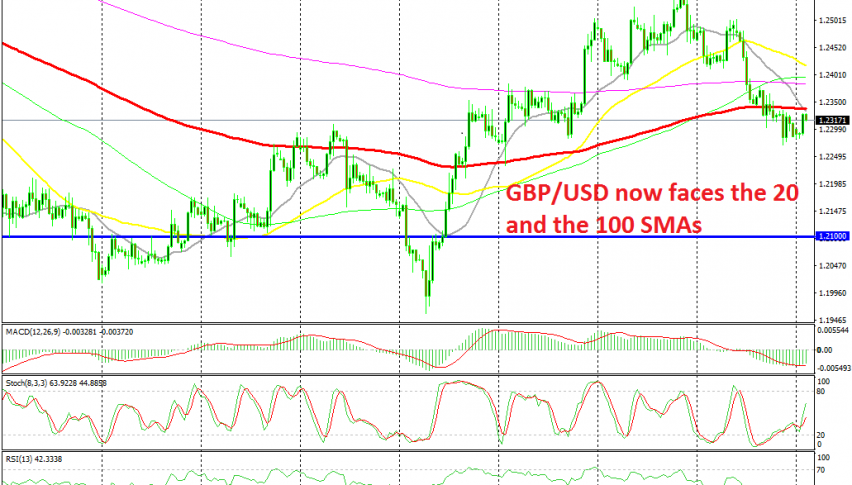
UK mortgage lending came lower as well at 3.85B vs 4.2B expected, but the GBP has climbed higher after this report. Although, GBP/USD is now facing the 20 SMA (grey) and the 100 SMA (red) on the H4 chart, as shown above.
Both these MAs have provided support or resistance before, so they should provide some resistance again now. They stand at 1.2340 and I might go short from there if the price climbs to that level.


