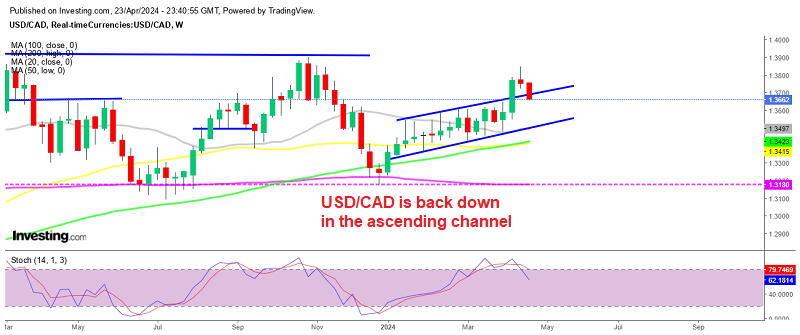
Shorting the Retrace on USD/CAD at the 50 SMA


USD/CAD turned pretty bearish last week, especially on Friday after the Canadian employment report was released. That was a pretty impressive report; employment posted some decent gains once again for September after a strong month in August, while the unemployment rate declined by 2 points to 5.5%.
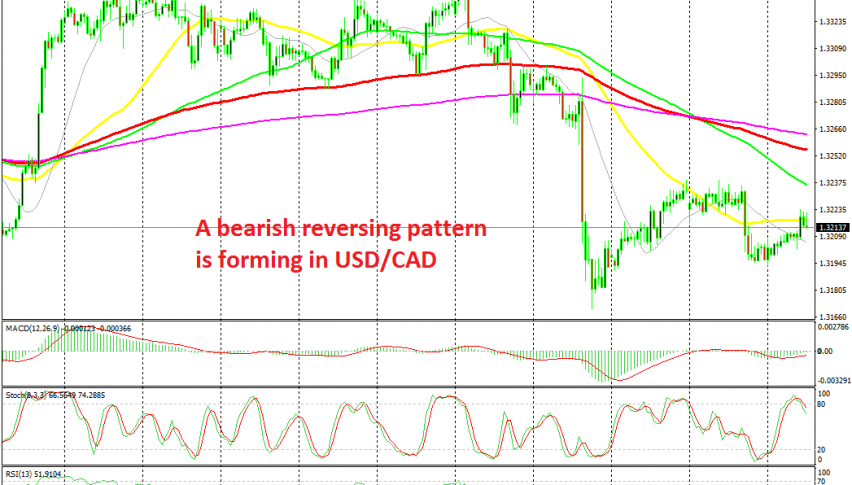
That sent USD/CAD around 120 pips lower that day. Although, on Monday we saw this pair retrace higher. The price found resistance at the 50 SMA (yellow) on the H1 chart that day, although it pushed above it yesterday. The price eventually turned bearish again yesterday in the US session, while today we are seeing another pullback higher. Once again though, the 50 SMA is providing resistance and the stochastic indicator is overbought, so we decided to go short from there.
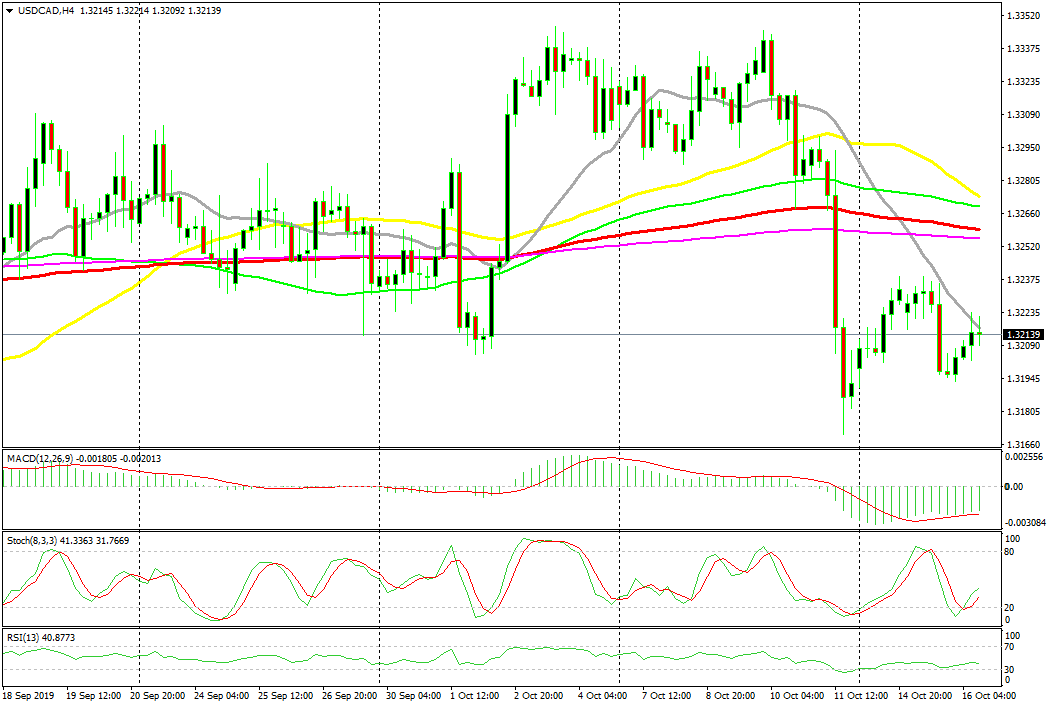
The 20 SMA is providing resistance on the H4 chart
Switching to the H4 chart, we see that here is the 20 SMA (grey) which is providing resistance. This moving average provided resistance yesterday, turning USD/CAD bearish and it is providing resistance again today. So,we have moving averages doing that job on two different time-frame charts.