AUD/USD Stays Below 50% Fibonacci – Quick Trade Plan
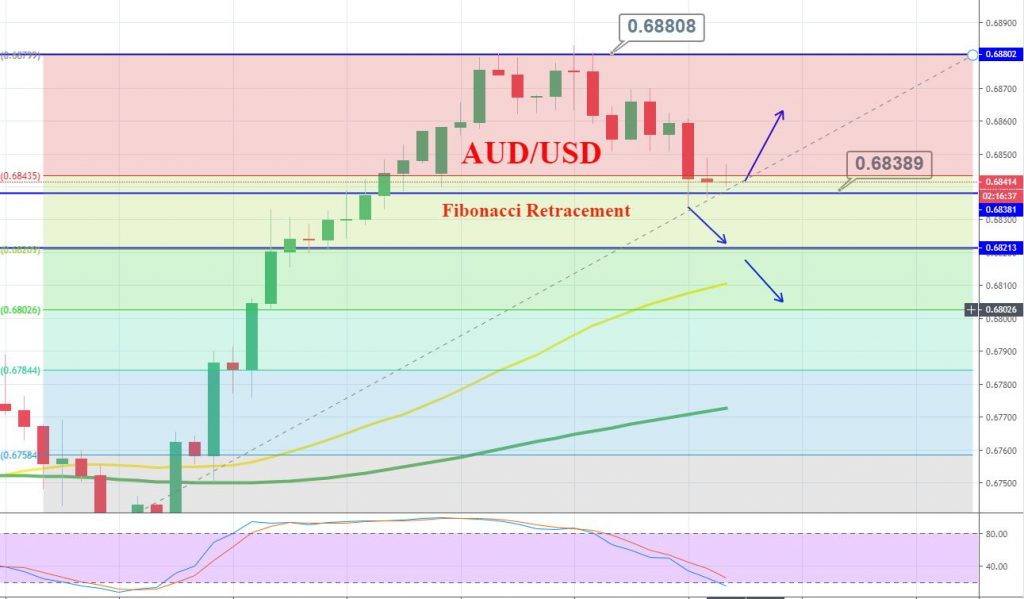
The AUD/USD currency pair taking the buying to 0.6860, despite taking a U-turn from 50% Fibonacci retracement. Apart from the 100-day simple
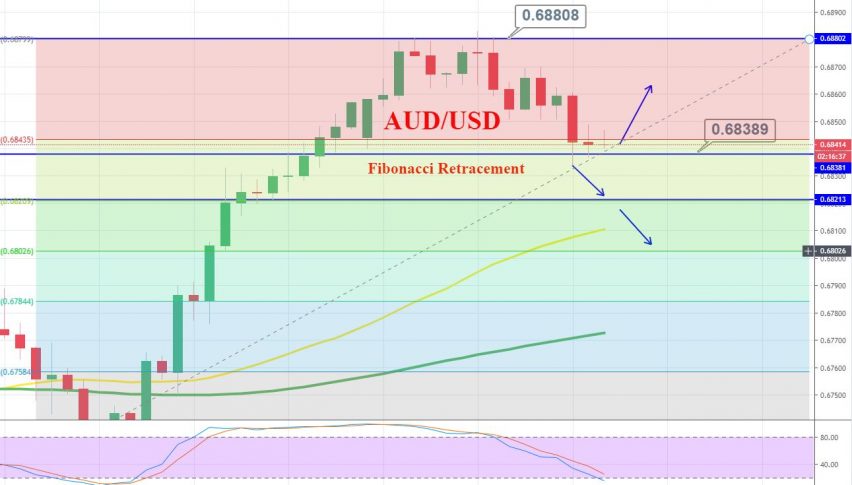
The AUD/USD currency pair has seen buying up to 0.6860, despite taking a U-turn from 50% Fibonacci retracement.
Apart from the 100-day simple moving average level of 0.6855, the bullish signals from twelve-bar Moving Average Convergence and Divergence (MACD) indicators also support the pair’s further rise.
During the pair’s further run-up to 0.6900, July month’s low around 0.6910 and 61.8% Fibonacci Retracement level of 0.6925 should be keenly watched.
While 38.2% Fibonacci retracement level near 0.6830 and October 11’s high of 0.6811 could come back on the chart if prices slip below 0.6855.
Daily Support and Resistance
S3 0.6801
S2 0.6832
S1 0.6845
Pivot Point 0.6863
R1 0.6876
R2 0.6894
R3 0.6925
AUD/USD – Forex Trading Signal
Consider trading bullish above 0.6835 and bearish below the same in order to capture quick take profit at 0.6800. The 50 and 100 EMA are supporting the pair around 0.6800. On the lower side, 38.2% Fibonacci support level is likely to work as a bearish target.
Good luck!
- Check out our free forex signals
- Follow the top economic events on FX Leaders economic calendar
- Trade better, discover more Forex Trading Strategies
- Open a FREE Trading Account
- Read our latest reviews on: Avatrade, Exness, HFM and XM
Related Articles


Sidebar rates
Related Posts
