Bitcoin Made a Bearish Move, Entering a New Range
Bitcoin was trading in a range around the 100 daily SMA for more than a month, but it broke lower on Wednesday
Cryptocurrencies turned pretty bullish in Q2 of this year, after the big decline last year. BITCOIN surged more than $10,000 higher, from around $3,000 to below $14,000 until the end of June. But, the climb ended up there and Bitcoin has retreated lower since then.
The highs were getting lower and they formed a bearish trend line. But, lows were not getting lower, so a support level formed around the $9,000 level and a triangle formed on the daily chart until the last week of September, when that support area was broken.
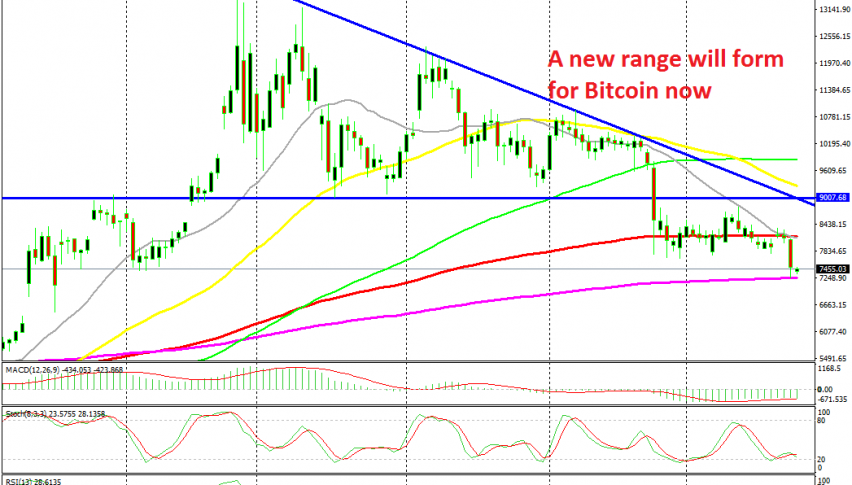
Since then, Bitcoin has traded in a range around the 100 SMA (red). But the 20 SMA (grey) started providing resistance when it caught up with the price, pushing the highs lower this month. Eventually, buyers gave up and Bitcoin made a bearish move on Wednesday, breaking below last month’s low.
But the decline stopped right at the 200 SMA (purple) which seems to have turned into support now. I expect Bitcoin to be trading between the 100 SMA at the top and the 200 SMA at the bottom for a few weeks before making another move, which could go both ways. But since the trend is bearish, a move down is more likely.
- Check out our free forex signals
- Follow the top economic events on FX Leaders economic calendar
- Trade better, discover more Forex Trading Strategies
- Open a FREE Trading Account