Gold Breaks the Range Again After the FED
Gold has been trading in a range for three weeks, but the range was broken yesterday to the upside afte the FED press conference
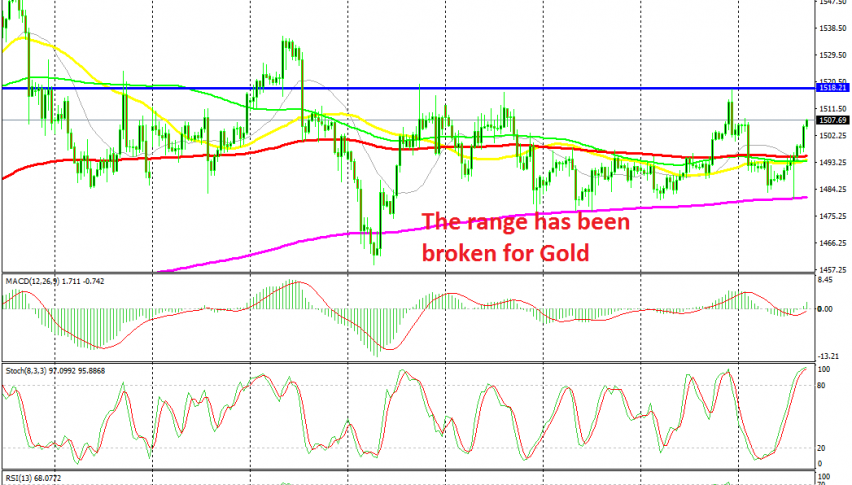
During the last three weeks I have highlighted the range in GOLD . The price has been trading between the 100 SMA (red) at the top and the 200 SMA (purple) at the bottom. Gold has been bouncing inside this range and yesterday we opened a sell signal at the top, booking profit quickly after the US GDP report, which came stronger than expected, sending the USD higher and Gold lower.
Gold retreated higher after that and fell down to the 200 SMA once again right after the FED rate cut and statement. The first few comments were positive in that statement, but the inflation comments were sort of dovish, which reversed the USD lower.
As a result, Gold turned higher and it broke above the 100 SMA (red) which is the top of the range. Now, Gold is headed for the resistance level at $1,518. That level has provided resistance several times before and reversed the price lower. Gold might turn lower again from there, but we have to see how it reacts up there. If the price forms a reversing pattern, we might go short at the resistance.
- Check out our free forex signals
- Follow the top economic events on FX Leaders economic calendar
- Trade better, discover more Forex Trading Strategies
- Open a FREE Trading Account
- Read our latest reviews on: Avatrade, Exness, HFM and XM
Related Articles

Sidebar rates
Related Posts
