Gold Makes the Big Break Down But Faces Another Support Level Now
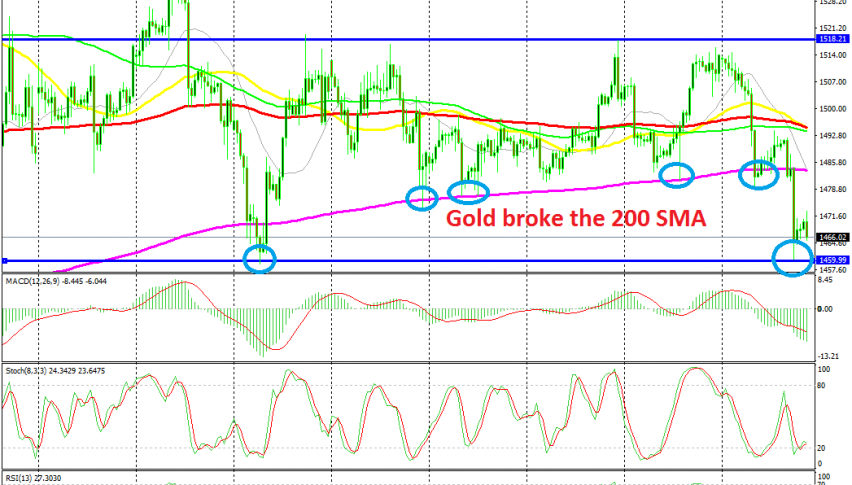
Gold has been trading in a range for 2 months, but the support at the 200 SMA was broken yesterday, which is a strong bearish signal
GOLD has been trading sideways in the last two months. It used to be really bullish during summer as the trade war escalated and the global economy weakened further, which turned the attention towards safe havens. But, the sentiment improved after summer and the demand for safe havens declined.
So, Gold has been trading sideways since mid September and it has formed a range on the H4 chart. The 200 SMA (purple) was defining the bottom of range and this moving average was pushing the lows higher, as it was moving higher. On Tuesday, the 200 SMA provided support once again as Gold turned bearish, but that moving average was eventually broken yesterday.
The top of the range has been at $1,518, although the 100 SMA (red) has also acted as resistance for some time. Last week we saw gold bounce off the 200 SMA and surge higher, as the FED remained dovish after cutting interest rates for the third time in a row.
But, the resistance level held once again and this week, the sentiment reversed in financial markets. The improvement in US ISM non-manufacturing improved the sentiment for the USD and the Buck has turned bullish this week. Gold turned bearish and the 200 SMA was finally broken, but the support at $1,460 held for Gold. We saw a bounce off this level yesterday, but the price is coming back down today and the support seems in danger as well now. So, Gold is pretty bearish now and we will try to pick a spot to sell when it retraces higher.
- Check out our free forex signals
- Follow the top economic events on FX Leaders economic calendar
- Trade better, discover more Forex Trading Strategies
- Open a FREE Trading Account
- Read our latest reviews on: Avatrade, Exness, HFM and XM
Related Articles


Sidebar rates
Related Posts
