Gold Trying to Make a Decision Whether to Stay Bearish or Turn Bullish
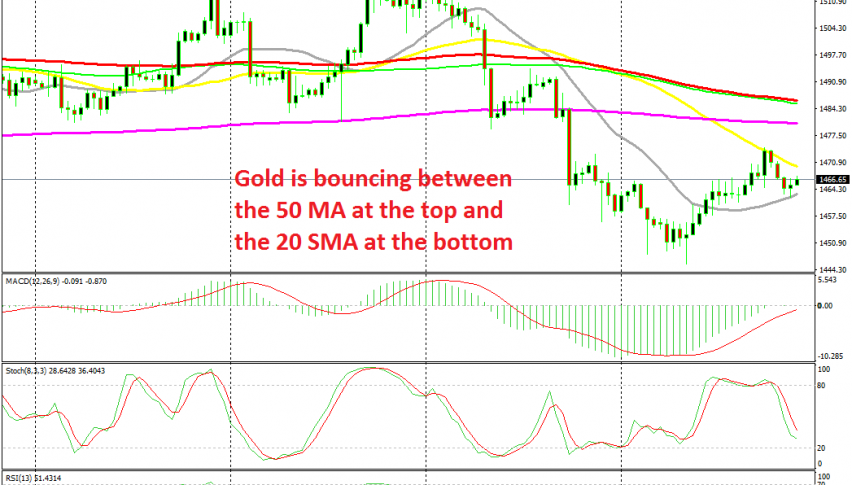
Gold found resistance at the 50 SMA yesterday, but it is finding support at the 20 SMA today
GOLD was trading sideways during October, as markets were uncertain. The sentiment improved last month after the partial trade deal agreement between US and China, which hasn’t gone official yet, but the global economy continued to weaken, as the US ISM manufacturing report showed.
So, Gold traders were uncertain whether to sell due to the improving sentiment, or buy it as the global economy deteriorated. During that time, the 200 SMA (purple) was providing support on the H4 chart, but last week sellers made a decisive move and Gold broke the 200 SMA and the range as well.
The downtrend stretched further down this week, but by Tuesday afternoon Gold reversed higher. The price formed a doji candlestick at the bottom, which is a bullish reversing signal and the reversal took place. Gold moved above the 20 SMA (grey), but found resistance at the 50 SMA (yellow) yesterday and it has reversed back down overnight.
Although, now Gold is finding support at the 20 SMA. This moving average has been holding for the last few hours and the price has formed another doji candlestick above it, which is yet another bullish reversing signal. The stochastic indicator is also overbought, so the decline is complete now.
So, Gold traders are deciding whether to keep the larger bearish trend going or to turn bullish. Since the decline is complete on the H4 chart now and Gold has formed a bullish reversing pattern, we might decide to go long on Gold, hoping for a bounce off the 20 SMA, targeting the 50 SMA above.
- Check out our free forex signals
- Follow the top economic events on FX Leaders economic calendar
- Trade better, discover more Forex Trading Strategies
- Open a FREE Trading Account
- Read our latest reviews on: Avatrade, Exness, HFM and XM
Related Articles


Sidebar rates
Related Posts
