Cashing 8n on NZD/USD as it Bounces Off the 20 SMA
NZD/USD was retracing lower yesterday, but the trend has been bullish for 2 months and the 20 SMA was providing support on the H4 chart
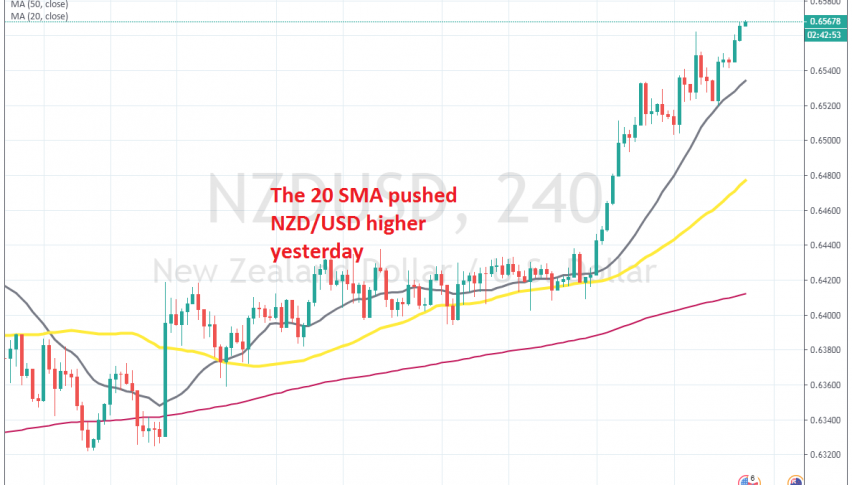
Yesterday we decided to go long on NZD/USD, as this pair was retracing lower on the H1 chart. The price reached the 50 SMA (yellow) on that time-frame which was providing support and the retrace seemed complete with stochastic oversold. Exactly the same scenario had happened the day before, with NZD/USD bouncing higher off that moving average, so we decided to take that opportunity yesterday.
Although, I hadn’t consulted the H4 chart before opening that trade, which I should have. Anyway, looking at it now, we see that the 20 SMA (grey) has caught up with the price yesterday, which added further strength to the support that the 50 SMA was providing on the H1 chart.
This moving average hasn’t been a pronounced support and resistance indicator before, but it did so yesterday, aided by the 50 SMA on the H1 chart as well. The fundamental picture seemed bullish as well, with the sentiment being slightly positive in financial markets,which is good for risk currencies and the USD remaining weak, as it has done all this week. Eventually, the price reversed higher and this morning I woke up to find this signal has reached the take profit target, so it proved to be a good trade.
- Check out our free forex signals
- Follow the top economic events on FX Leaders economic calendar
- Trade better, discover more Forex Trading Strategies
- Open a FREE Trading Account