Crude Oil Retracing Lower Before the Next Bullish Move?


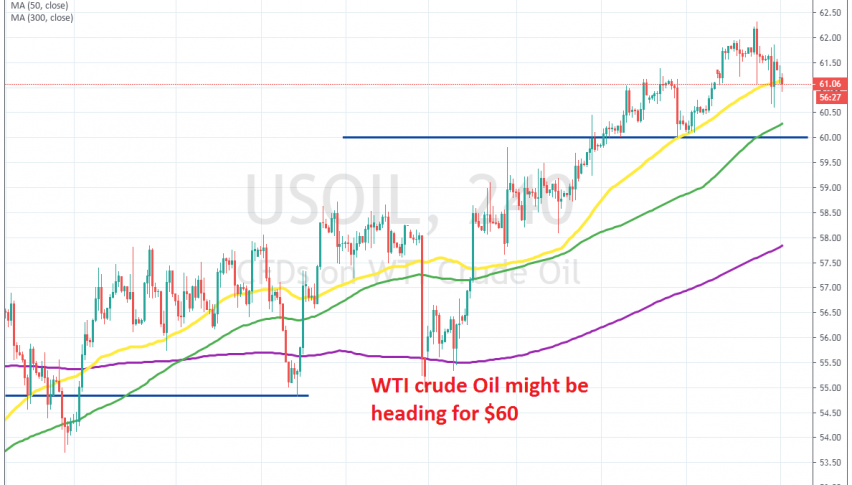
Crude Oil has been on a bullish trend since the middle of September when it reversed at the support zone above the $50 level. Since then, US WTI crude has gained more than $10. The global economy has been weakening, which should have been negative for Oil prices, but the rummours regarding new quotas from OPEC+ have kept it going.
Not all members wanted to reduce oil production further, but Saudi Arabia pushed ahead with it and about a month ago they declined to curb production by an additional 50k barrels/day. That sent WTI crude above the next resistance level at $60 by the middle of December.
That resistance level turned into support immediately. It held during the retrace lower, but was aided by the 50 SMA (yellow) as well, on the daily chart. On January 31 we saw another retrace lower and the price pierced the 50 SMA, but it reversed back up above it. Today we are seeing another pullback lower and the price has slipped below that moving average again, as you can see form the chart above.
If this moving average goes, then the next target will be the 100 SMA (green), which comes at $60.30, then it’s the support level at $60. No one knows if the pullback will stretch down there, which is not too far by the way; but if it does, then it will be a good chance to look to buy, targeting 100-150 pips, with a stop below $60.