Should We Buy the Retrace in Bitcoin at the 20 Daily SMA?
Bitcoin has been bullish sop far this year, but it has retraced lower now and we are trying to decide whether to go long
BITCOIN had a great run in Q2 of last year, as crytpocurrencies turned massively bullish. Bitcoin gained more than $10,000, having started from above $3,000. But, after that climb ended by the end of June, Bitcoin reversed to bearish and fell to $6,300s.
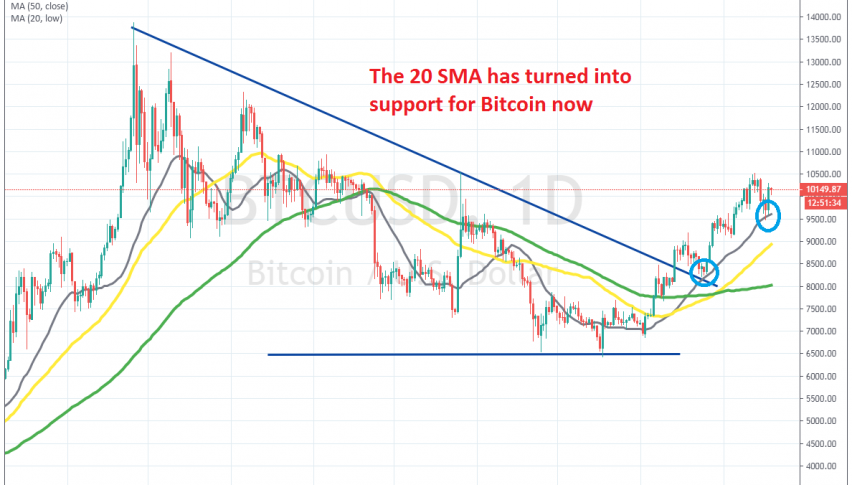
During the bearish period, moving averages turned from support into resistance for Bitcoin. The 100 SMA (green) in particular, did a great job in providing resistance last year. But, it seems like the same moving averages that provided resistance before have turned into support again now.
The 50 SMA (yellow) was providing resistance but it was broken at the beginning of January. Then the 100 SMA offered some resistance for some time, but it didn’t resist for too long either and was broken later on. At the end of January we saw a retrace lower, but the 100 SMA turned into support, aided by the 20 SMA as well. The price bounced off from there and made new highs for the year.
Now, we are seeing another pullback down and Bitcoin has lost around $1,000. The retrace seems complete now on the daily chart and the 20 SMA is providing support again. So, this seems like a good opportunity to go long. But, I think I will wait a bit longer to see if we can get a bullish reversing signal, such as a doji candlestick.
- Check out our free forex signals
- Follow the top economic events on FX Leaders economic calendar
- Trade better, discover more Forex Trading Strategies
- Open a FREE Trading Account
- Read our latest reviews on: Avatrade, Exness, HFM and XM
Related Articles


Sidebar rates
Related Posts
