EUR/GBP Reverses at the 50 SMA Again
EUR/GBP retraced higher today, but the 50 SMA stopped the climb once again on the H1 chart
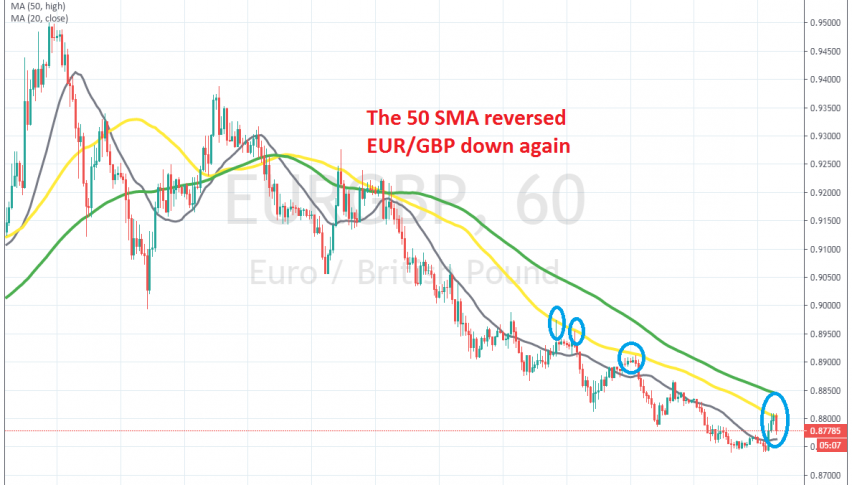
EUR/GBP turned bearish by the middle of March and it has been declining since then, losing nearly 8 cents in about two weeks. During the second half of February and the first half of March, we saw this pair surge higher as the GBP/USD crashed 18 cents lower, but the GBP has retraced higher in the last two weeks and EUR/GBP has turned bearish as a result.
The decline has been quite steep, especially this month and the moving averages show that. Tha larger MAs haven’t been able to catch up with the price, so the 20 SMA (grey) and the 50 SMA (yellow) have been providing resistance during pullbacks, thus pushing this pair lower.
Today, we saw a retrace higher on the H1 chart, as GBP/USD turned bearish, after consolidating below 1.25 for nearly a week. But, the retrace ended at the 50 SMA on the H1 chart, once again. Now, EUR/GBP is turning lower again, after the 50 SMA rejected the price for the fourth time in the last several days.
We missed the chance to go short, but the price is not to far from the 50 SMA, so we might actually try to sell this pair. Although, not right now, but you can follow our signals page to see when we will open this trade, if the price retraces a bit higher again.
- Check out our free forex signals
- Follow the top economic events on FX Leaders economic calendar
- Trade better, discover more Forex Trading Strategies
- Open a FREE Trading Account
- Read our latest reviews on: Avatrade, Exness, HFM and XM
Related Articles

Sidebar rates
Related Posts
