GBP/USD Continues to Trade in the Range, After Bouncing Off the 100 SMA
[[GBP/USD]] crashed lower by the middle of March. This pair lost 18 cents in a couple of weeks, as the coronavirus spread panic across Europe and the World. But, last week we saw a really strong reversal, with GBP/USD climbing nearly 11 vents higher, as the USD turned bearish on the $2 trillion bill from the US government.
But, the climb stopped right below the big round level at 1.25. That’s where the 100 smooth moving average was also standing on the H4 chart. That moving average helped to provide resistance at 1.25 and it has been doing so all this week, killing any attempt to push higher from buyers.
So, a resistance zone has formed below 1.25. Buyers have tried three times to break that resistance level but they have failed. Yesterday was the last attempt from buyers, but it seems like they have given up now, after failing for the third time.
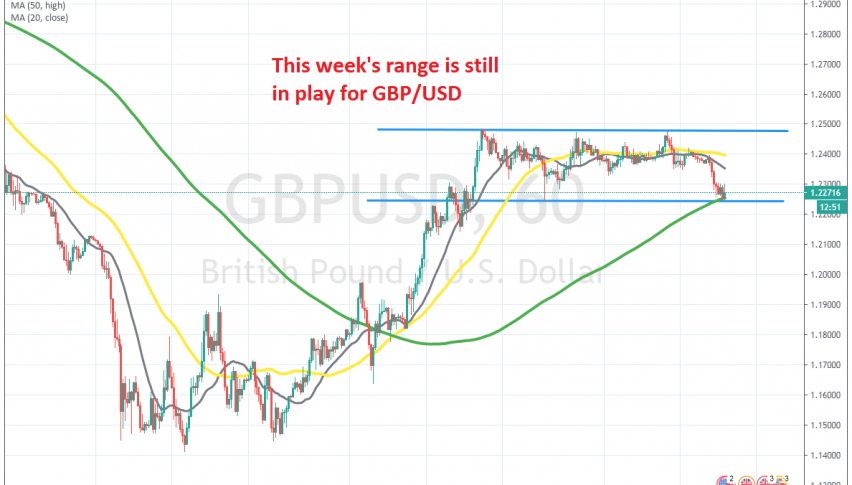
GBP/USD reversed lower and has lost more than 200 pips, but the low from Monday at 1.2250 held again today, also helped by the 100 SMA, this time on the H1 chart, as shown above. This pair bounced more than 50 pips higher, but it is retreating back down now.So, the range between 1.2250 and 1.25 continues for this pair. let’s see if sellers will break the support, since we are already short since last week.


