Will GBP/USD Reverse at the 50 Daily SMA Now


GBP/USD went through a major crash in the first half of the month, falling around 18 cents, from 1.32 to 1.14. The GBP played a part in that big decline, since it turned weaker than all other major currencies, while the USD surged as a world reserve currency.
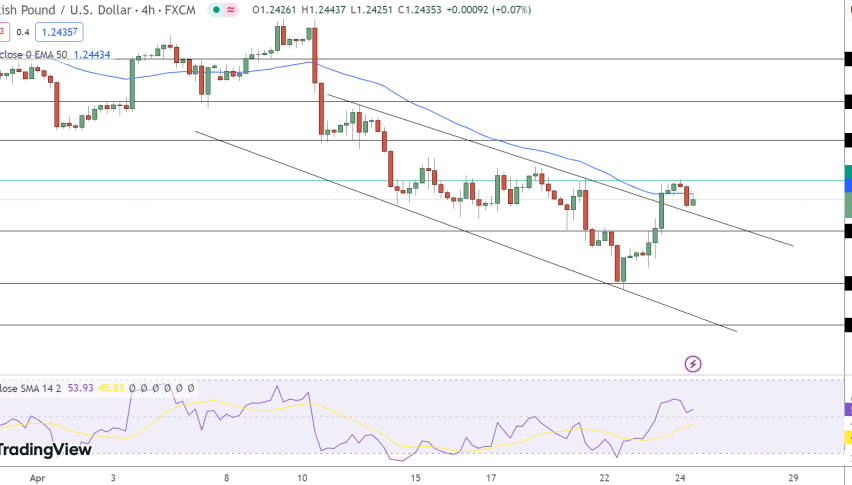
But, the market turned away from the USD in the following week and GBP/USD surged higher, climbing nearly 11 cents higher. But the area below 1.25 turned into a resistance zone and this pair failed to push above, despite several attempts from buyers.
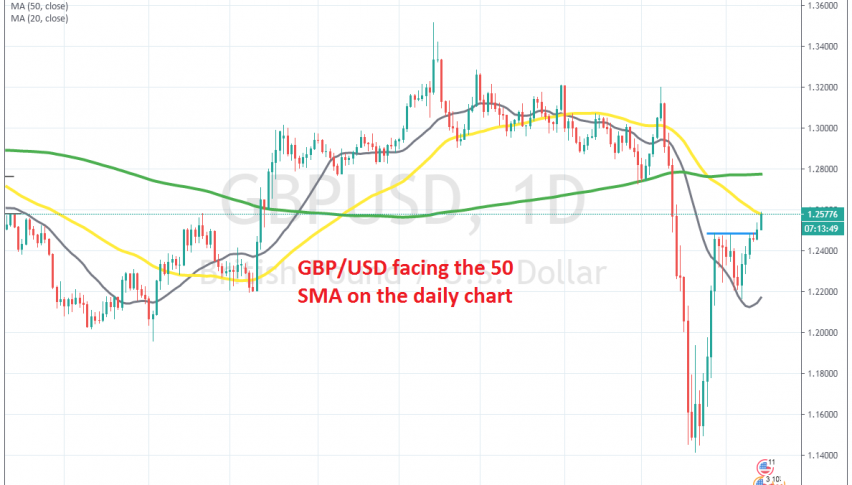
The price started to slip lower, but the 20 SMA (grey) turned into support on the daily chart, holding on during the retrace. The price fell to 1.2150s, but then reversed after sellers failed to break below that moving average. GBP/USD turned bullish again last week and yesterday buyers managed to push above the resistance zone and above 1.25. Although, now they are facing the 50 SMA (yellow) which might turn into resitsnace. We hope it does, since we are short on this pair.