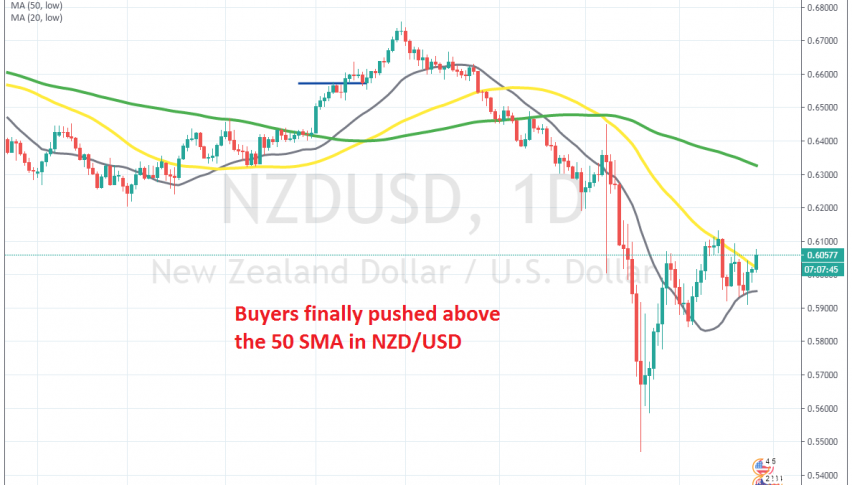
NZD/USD Finally Breaks Above the 50 Daily SMA
NZD/USD has bounced off the 20 SMA on the daily chart and today it broke above the 50 SMA
[[NZD/USD]] turned bearish as soon as 2020 started, after having retraced higher during Q4 of 2019. This pair lost more than 5 cents during the first two months, but then crashed down in March, as conronavirus spread globally. New Zealand has been one of the few countries where coronavirus has spread only marginally, or hasn’t spread at all, but the Kiwi fell nonetheless, as the USD surged.
The decline accounted for about 10 cents but ended by March 20 and started reversing higher as the USD retreated lower. The price moved above the 20 SMA (grey) but then started puling back lower. Although, the 20 SMA turned into support, holding during the decline lower.
Eventually, buyers returned as the 20 SMA held well and NZD/USD climbed higher again. But, this time the 50 SMA (yellow) turned into resistance on the daily chart. Buyers pierced it for a short while, but the price reversed back down, so that didn’t count as a breakout. The 20 SMA held well once again though, and last Thursday buyers gave another push higher.
But, they gave up at the 20 SMA for the third time since early March. Today though, buyers returned as the USD pulled back lower across the board and the 50 SMA has been finally broken. Unless, the price declines around 50 pips lower, falling back below it, which I doubt. So, the bullish momentum has returned in this pair and I think that we will see this pair move lower in the coming weeks.
- Check out our free forex signals
- Follow the top economic events on FX Leaders economic calendar
- Trade better, discover more Forex Trading Strategies
- Open a FREE Trading Account
- Read our latest reviews on: Avatrade, Exness, HFM and XM
Related Articles


Sidebar rates
Related Posts
