Shorting the Pullback in GBP/USD at the MAs
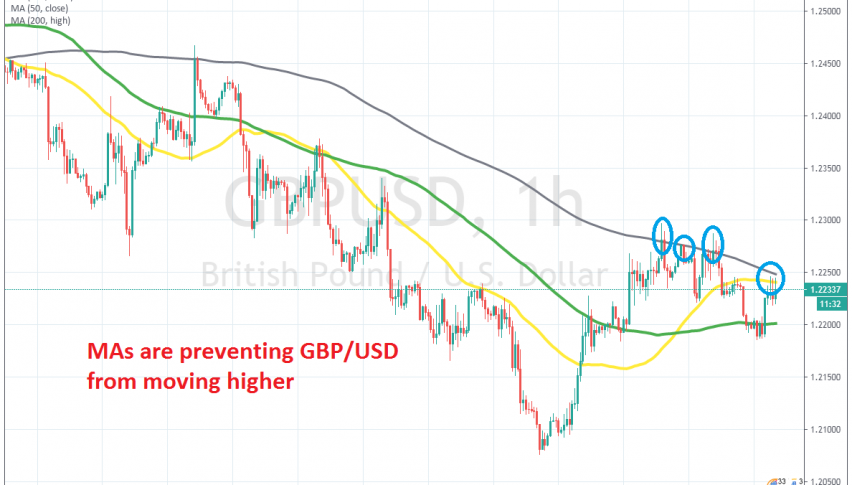
GBP/USD retraced higher this week, but the retrace seems to have ended at the 50 SMA on he H4 chart
[[GBP/USD]] turned quite bullish from mid March until the beginning of this month, following a 18 cents crash earlier in March. But the crash ended back then and the GBP started climbing higher, reaching 1.2650s at some point. Although that level formed a resistance zone around it, which prevented this pair from climbing higher.
The last attempt to move higher above the resistance level took place at the end of last month, which wasn’t successful. As soon as this month started, GBP/USD turned bearish after failing at the resistance for the second time. That failure to break 1.2650s formed a double top pattern in this pair.
The double top pattern suggests that this pair should fall to 1.1850s, although the decline stopped short of that at the end of last week. This week we have seen GBP/USD retrace higher, but it seems like the 50 SMA (yellow) turned into resistance on the H4 chart. This moving average reversed the price lower yesterday and did so again today, after forming a doji candlestick up there, which is a reversing signal. We decided to open a sell forex signal here, which is now heading for the take profit target, since GBP/USD is turning lower again.
- Check out our free forex signals
- Follow the top economic events on FX Leaders economic calendar
- Trade better, discover more Forex Trading Strategies
- Open a FREE Trading Account
- Read our latest reviews on: Avatrade, Exness, HFM and XM
Related Articles


Sidebar rates
Related Posts
