

USD/CAD has been bearish since the middle of March, following the big crash earlier that month. This pair fell around 14 cents, from 1.47 to 1.33, as the USD turned bearish, while crude Oil came back from the dead, which gave the CAD a boos, since they are closely correlated.
The decline stopped buy the middle of June and for about a month USD/CAD traded within a 200 pip range as uncertainty prevailed. Markets were uncertain whether to remain bearish on the USD or turn bullish. But, they took that decision earlier this month.
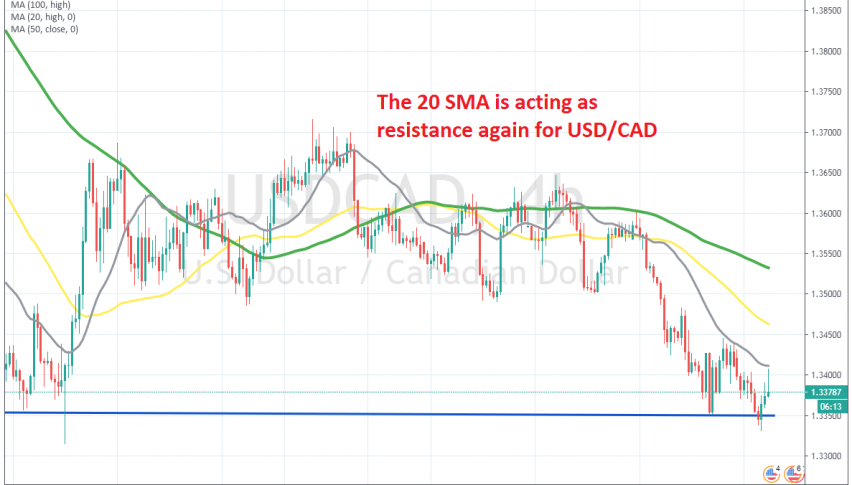
USD/CAD turned bearish finally, after forming an upside-down hammer candlestick below the 100 SMA (green) on the H4 chart, which is a bearish reversing signal. This pair fell to 1.3350s initially lat week, but bounced higher, although the 20 SMA (grey) provided resistance and reversed the price back down.
Today we are seeing another pullback higher, but the 20 SMA is acting as resistance again on this chart. We decided to take this opportunity and open a sell forex signal, since the 20 SMA is rejecting the price again. Now, we are hoping that the bearish trend resumes again, which seems like it is, so the chart looks good for our trade.