The Pullback Seems Complete for Dax on the Daily Chart


Stock markets have been bullish for about a decade, since the 2008-09 global crisis started to fade. The cash has been flowing into markets from central banks, which has been keeping the sentiment positive for stock markets, with the German index DAX climbing from around $3,000 in 2009, to above $13,000.
But in February the coronavirus came and the sentiment turned massively negative. Stock markets took a deep dive, with Dax30 falling more than 1,000 points. But, the world didn’t end and stock markets reversed higher by the middle of March.
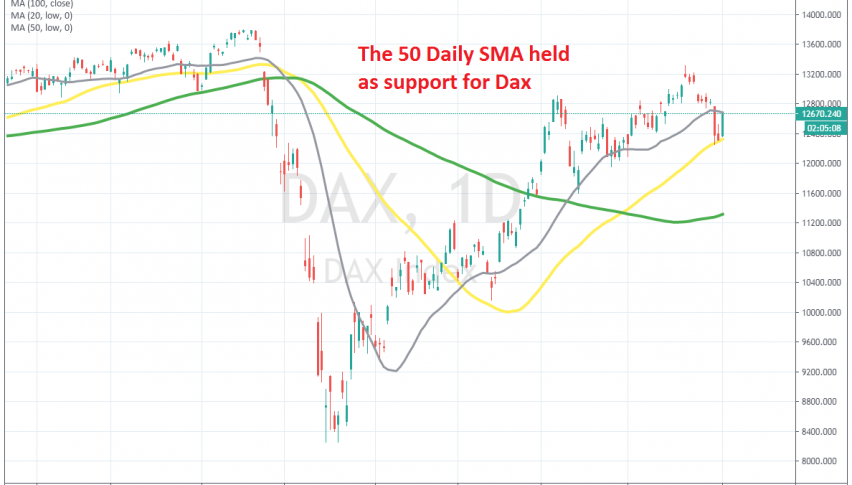
Dax climbed above $13,000 again, but by the middle of last week the sentiment started to turn bearish for stocks and Dax started to reverse down after forming an upside-down hammer candlestick, which is a bearish reversing signal. The price fell below the 20 SMA (grey) which had been providing support before, but the 50 SMA (yellow) held as support on the daily chart.
We opened a buy forex signal on Friday last week above the 50 SMA, hoping for a bounce and now it seems like the bounce has come. Dax jumped more than 500 points, and we closed the trade for a hefty profit. Although, we see that the price is trading at the 20 SMA again now. I am hoping that this moving average will provide some sort of support, reversing the price back down, where I am planning to go long again. But, let’s see if the 20 SMA will reject the price in the first attempt.