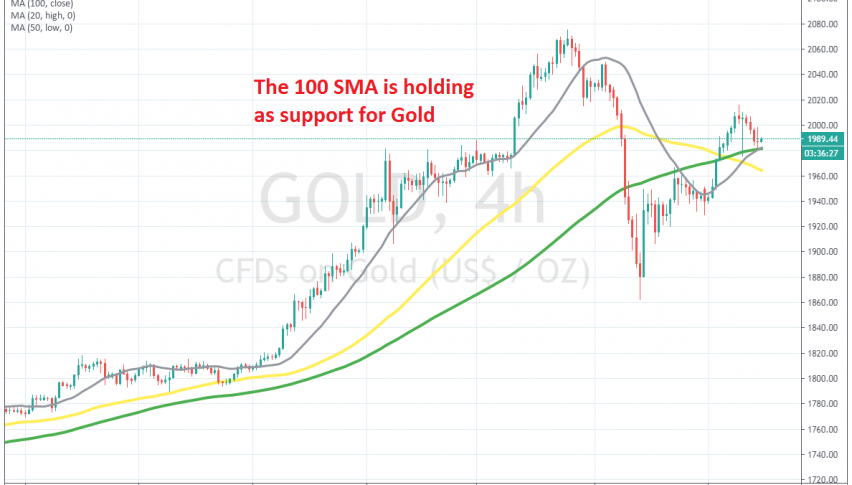
Gold Forming A Bullish Reversing Pattern on the H4 Chart


GOLD has been really bullish this year, as the sentiment turned massively negative during the lock-downs, which helps safe havens such as Gold. As a result, Gold has surged more than $600 from the bottom to the top, which it put in place in the first week of August.
But, we saw a respectable pullback during the second week of August, which took Gold down to $1,862. But the decline stopped right at the 200 SMA (grey) on the H4 chart. That moving average was pierced for a while, but the price retreated back up and the H4 candlestick closed above it, so there was no official break.
Gold bounced off the 100 SMA and climbed above the $2,000 level again last week. Although, today we are seeing another pullback down on this chart, but the retreat has ran into the 100 SMA (green), which has been providing support. Gold formed a doji candlestick above the 100 SMA, which is a reversing signal after the decline, so we decided to open a buy Gold signal. Now, we are hoping to see Gold bounce higher off the 100 SMA.