

GOLD has been really bullish this year, as the coronavirus lock-downs turned the sentiment massively negative in financial markets. That increased the demand for safe havens, which sent them surging, with Gold breaking the all time high at $1,920 in the last week of July.
The big round level at $2,000 was also broken in the first week of August and buyers pushed Gold higher to $2,075. But, all trends come to an end at some point and Gold stopped climbing higher since the first week of this month and reversed down.
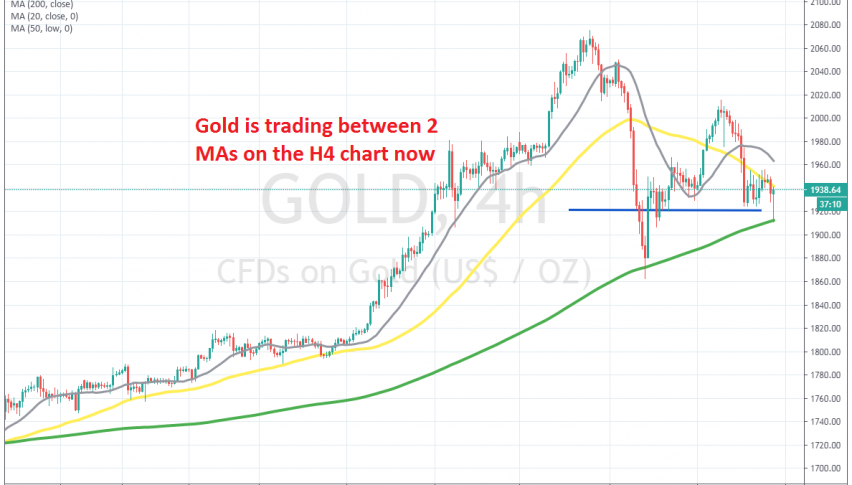
But, the 100 SMA (green) held as support on the H4 chart, despite being pierced briefly. The price bounced off that moving average and climbed around $150 higher, which means 1,500 pips. But the price reversed back down and today Gold declined to the 100 SMA, which held as support once again. We were long on Gold and closed the trade below the 50 SMA (yellow) which is acting as resistance now. Although, we might go long again, if the price falls close tothe 100 SMA again.