Gold Finding Support at the 200 SMA Once Again
Gold has turned bearish again today, but the 100 SMA is holding as support on the H4 chart
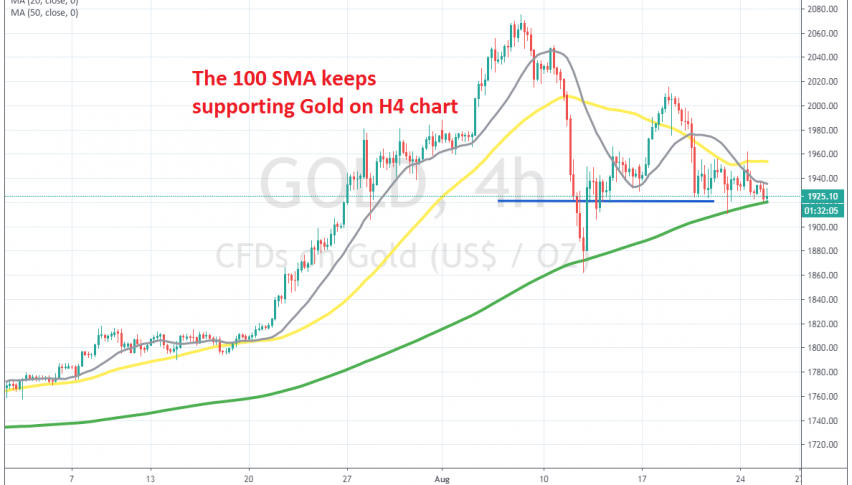
GOLD has been bullish for a couple of years now and this year this safe haven turned even more bullish, as the risk aversion sentiment sent safe havens higher. Gold pushed above the previous high and broke the $2,000 and made a new high, at $2,075 in the first week of August.
But buyers couldn’t hang on to the gains above $2,000 and we saw a major decline, with Gold falling more than $200 lower in a few days. Although the 200 SMA (green) held as support on the H4 chart and Gold bounced higher from there, climbing above the $2,000 level again.
But, buyers couldn’t hold on to gains above that big round level again and last week Gold turned bearish again. Yet, the 200 SMA held as support once again, sending Gold $50 higher. The price reversed down again, with the 50 SMA (yellow) having turned into resistance on the H4 chart now, while the 200 SMA is still holding as support on the H4 chart. So, the range is narrowing in Gold and a triangle is forming. It remains to be seen in which direction Gold will head next; whichever moving average goes first will give us a hint at the direction after the breakout.
- Check out our free forex signals
- Follow the top economic events on FX Leaders economic calendar
- Trade better, discover more Forex Trading Strategies
- Open a FREE Trading Account
- Read our latest reviews on: Avatrade, Exness, HFM and XM
Related Articles


Sidebar rates
Related Posts
